How to use Distributed Tracing to maximize the Observability of your IoT applications
Introduction
IoT applications are generally deployed in a distributed environment and the messages that are exchanged within this setup have to transit through multiple components, including MQTT brokers.
For DevOps and SRE teams, the ability to trace messages through this environment is vital. Unfortunately, the currently available MQTT brokers cannot continuously gather metadata on requests/messages which creates gaps in traces that ultimately impact the service level objectives for the responsible teams.
This post explores how HiveMQ (starting with version 4.9) is solving the problem with the help of Distributed Tracing and OpenTelemetery.
Why do you need Distributed Tracing
Logs, metrics, and traces are seen as the three pillars of observability.
While traces give you insights into what’s happening in your distributed system, this information should be used to rank and filter logs and metrics from the components you are interested in.
In a distributed system, the processing of a transaction happens on multiple systems and classic observability tools (logs, metrics) are not sufficient anymore.
Also, when you run services in the cloud, you don’t have direct control over these services. A mechanism is needed to add a common context to traffic moving between distributed services. Distributed Tracing provides this mechanism.
Distributed Tracing is a method to follow messages through multiple and complex systems. It allows a high-level overview of a message’s journey so teams analyzing issues can isolate potential problems, and then dive deeper into identified systems.
This is helpful in situations where production systems exhibit problems like high latency or dropped messages, and a root cause analysis is needed. As an example, if an ACME-built car is taking upwards of 5 seconds to unlock via the mobile app, the teams need to find out what’s causing the delay. With distributed tracing, DevOps, SREs, software architects, developers, and other technical teams can:
Analyze message flows to understand which step is causing, for instance, latency issues in an application.
Spot critical system components and create a baseline for their performance.
Raise tickets with the appropriate teams and vendors since they now have contextual diagnostics information.
In summary, Distributed Tracing can help businesses radically reduce their Mean Time To Resolution (MTTR) KPI and optimize performance and resource utilization.
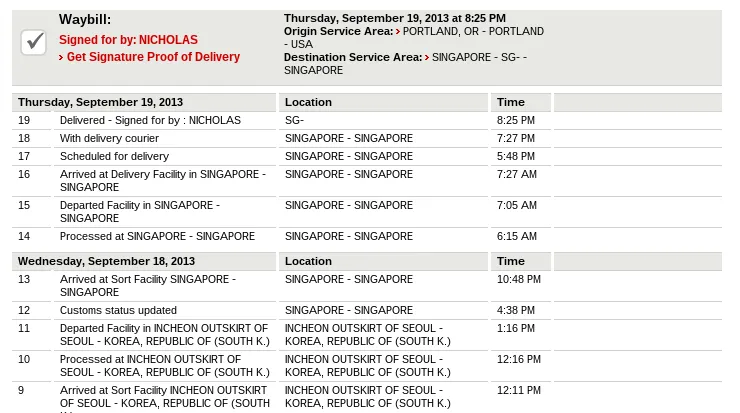
A good analogy to understand how Distributed Tracing works is tracking a package within the shipment process. Throughout its journey, a package comes across different people, companies, modes of transport, locations, etc. The last status is always updated on the tracking website. The courier company’s operations team always knows where the package is and can detect if there are any unexpected delays. If a package is delayed or lost, the operations team knows where to start looking.
Distributed Tracing does the same with application data. Users can identify and trace each message’s journey at a granular level. If there is an issue, they know exactly where to look.
 The following table helps to understand the concepts of Distributed Tracing based on the package shipment analogy
| Shipment Tracking | Distributed Tracing |
|---|---|
| Tracking report | Trace |
| Tracking ID / number | Trace ID |
| Stop-over | Span |
| Name of the stop-over | Span ID |
How can you bring Distributed Tracing to life in your HiveMQ-powered IoT environment
 OpenTelemetry is an open-source observability framework. The framework includes tools, APIs, and SDKs which help in instrumenting systems to generate, collect, and export telemetry data.
The trace data can then be fed into a supported APM system and be used to plot and render traces across the environment.
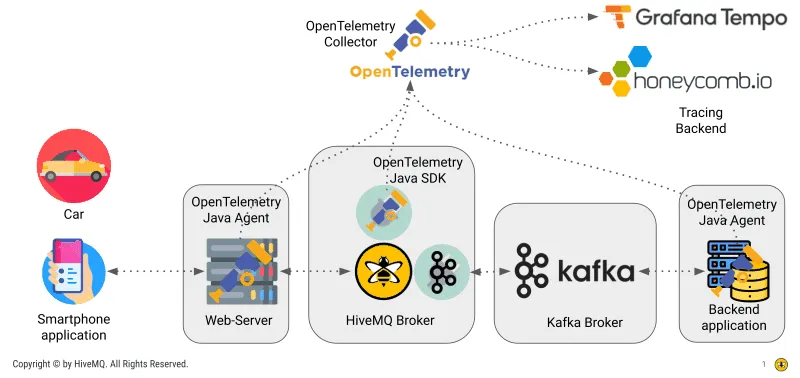
With its 4.9 release, the HiveMQ broker and the HiveMQ Enterprise Extension for Kafka can now be instrumented according to OpenTelemetry specifications.
A new Open-Standards-based tracing mechanism for MQTT messages
The HiveMQ broker, with the HiveMQ Enterprise Distributed Tracing Extension, offers OpenTelemetry capabilities which also extends to traffic transiting the Enterprise Extension for Kafka
All sent/received MQTT PUBLISH messages in the HiveMQ broker and Sent/Received Kafka records in the Kafka Extension are traced by the extension. In the broker, tracing support is included for “PublishInboundIntercepors”, “PublishOutboundInterceptors”, and “PublishAuthorizers . For the Kafka extension, the tracing covers sending and/receiving Kafka records for both mappings and transformers. Latency and the number of exceptions are available.
We have included sample results in the screenshots below. These screenshots show a commercial APM solution and the open-source APM - Grafana Stack.
In Summary: Distributed Tracing can be a game-changer for your business
IoT deployments can extend to 10s of-thousands (and in some cases millions) of connected devices. Distributed Tracing can help you:
Move from a reactive to proactive support strategy
Make your IoT applications more productive and resilient
Swiftly discover and resolve issues
Get more value from your APM investments.
HiveMQ Team
The HiveMQ team loves writing about MQTT, Sparkplug, Industrial IoT, protocols, how to deploy our platform, and more. We focus on industries ranging from energy, to transportation and logistics, to automotive manufacturing. Our experts are here to help, contact us with any questions.
