Sending Filtered MQTT Sparkplug Messages to MongoDB for IIoT Data Transformation: Part 1
At HiveMQ, we talk to customers about their IIoT use cases, such as real-time asset monitoring and performance, predictive maintenance, inventory management, driving operational efficiency, and much more. Across these use cases, customers rely on real-time data for trend analysis and rapid decision-making. However, when integrating Sparkplug-enabled OT devices with IT systems such as MES, Historians, and analytics platforms, customers often encounter several key data-processing challenges. For example, to generate analytics, you first have to transform the data from the Sparkplug (Protobuf) format to JSON. Imagine a scenario where only a subset of the Sparkplug metrics are updated. In this case, much of the data will be redundant. At scale, this can lead to reaching the limits of your compute and storage infrastructure.
With HiveMQ Broker, you can use Data Hub to transform data, write custom logic to process the data for your use case, fan out metrics to specific MQTT topics, and use our Extensions to stream the data to a third-party service like Amazon Kinesis, Snowflake, Postgres, MongoDB, and more. For the full set of Extensions we support, refer to our Extensions documentation.
Over a series of two blog posts, we show you how to use Data Hub to connect the OT and IT worlds together. In this first post, we’ll show you, step-by-step, how to convert an MQTT Sparkplug message to JSON and fan out metrics to the original topic prefix (suffixed by the metric name). In the second part, we’ll show you a technique to pass arguments from the data policy to the transformation script so we can filter out unwanted Sparkplug metrics. Finally, we’ll use the HiveMQ MongoDB Extension to forward the data to a MongoDB database. In our example, we could easily use any of our Extensions; however, for simplicity, we are showing our MongoDB integration. With the introduction covered, let’s begin with Part 1.
Using Data Hub to Transform Sparkplug Data and Filter Metrics
With HiveMQ’s Data Hub, you can define how MQTT data is handled in the HiveMQ Broker for a given topic filter using Data Policies and a Data Schema. First, you ensure that the data received by the Broker complies with the Data Schema. If it does not comply, you can perform an action such as redirect the message to an MQTT topic, drop the MQTT message, disconnect the client, or log a message. If it complies, you can transform the MQTT message with a custom JavaScript-based transformation function. Additionally, using Behavior Policies, you can define how the Broker responds to client behavior.
Data Hub takes care of executing all the steps required to validate that the Sparkplug data complies to the defined Data Schema as well as the transformation script. At the same time, Data Hub continually monitors client behavior taking action if necessary. Additionally, in HiveMQ 4.30, we released Data Hub Modules, which is a quick and simple way to transform MQTT Sparkplug messages to JSON. We recommend using this feature if you have a simple Sparkplug-to-JSON transformation use case that doesn’t require any custom functionality, and you only want to fan out metrics to the original topic prefix.
Challenges with Sparkplug Data
Let’s first recap on what Sparkplug is and review some of the challenges customers face when writing applications to process Sparkplug data.
Sparkplug is a widely used format based on MQTT. The current standard encodes the collected IIoT data in Google’s Protocol Buffer format, which is a compact binary format known as Protobuf.
A challenge for some applications is that they are unable to read the Sparkplug format or handle deeply nested data structures containing multiple metrics per MQTT payload. This can happen if the Sparkplug format contains multiple IIoT data points (called metrics) that aggregate multiple data points into a single MQTT payload.
In the following sections, we’ll demonstrate how to convert each metric from a single Sparkplug MQTT message into JSON format.
Solving the Challenges Processing Sparkplug Data
The solution we’ll build involves a sequence of five individual steps. Before we describe them in more detail, let’s first look at the end-to-end architecture shown in Figure 1. The data source emitting Sparkplug messages is shown on the left-hand side. The Sparkplug messages arrive at the Broker, are deserialized, transformed, and encoded as JSON. Finally, the JSON messages are streamed into a MongoDB shown on the right-hand side.
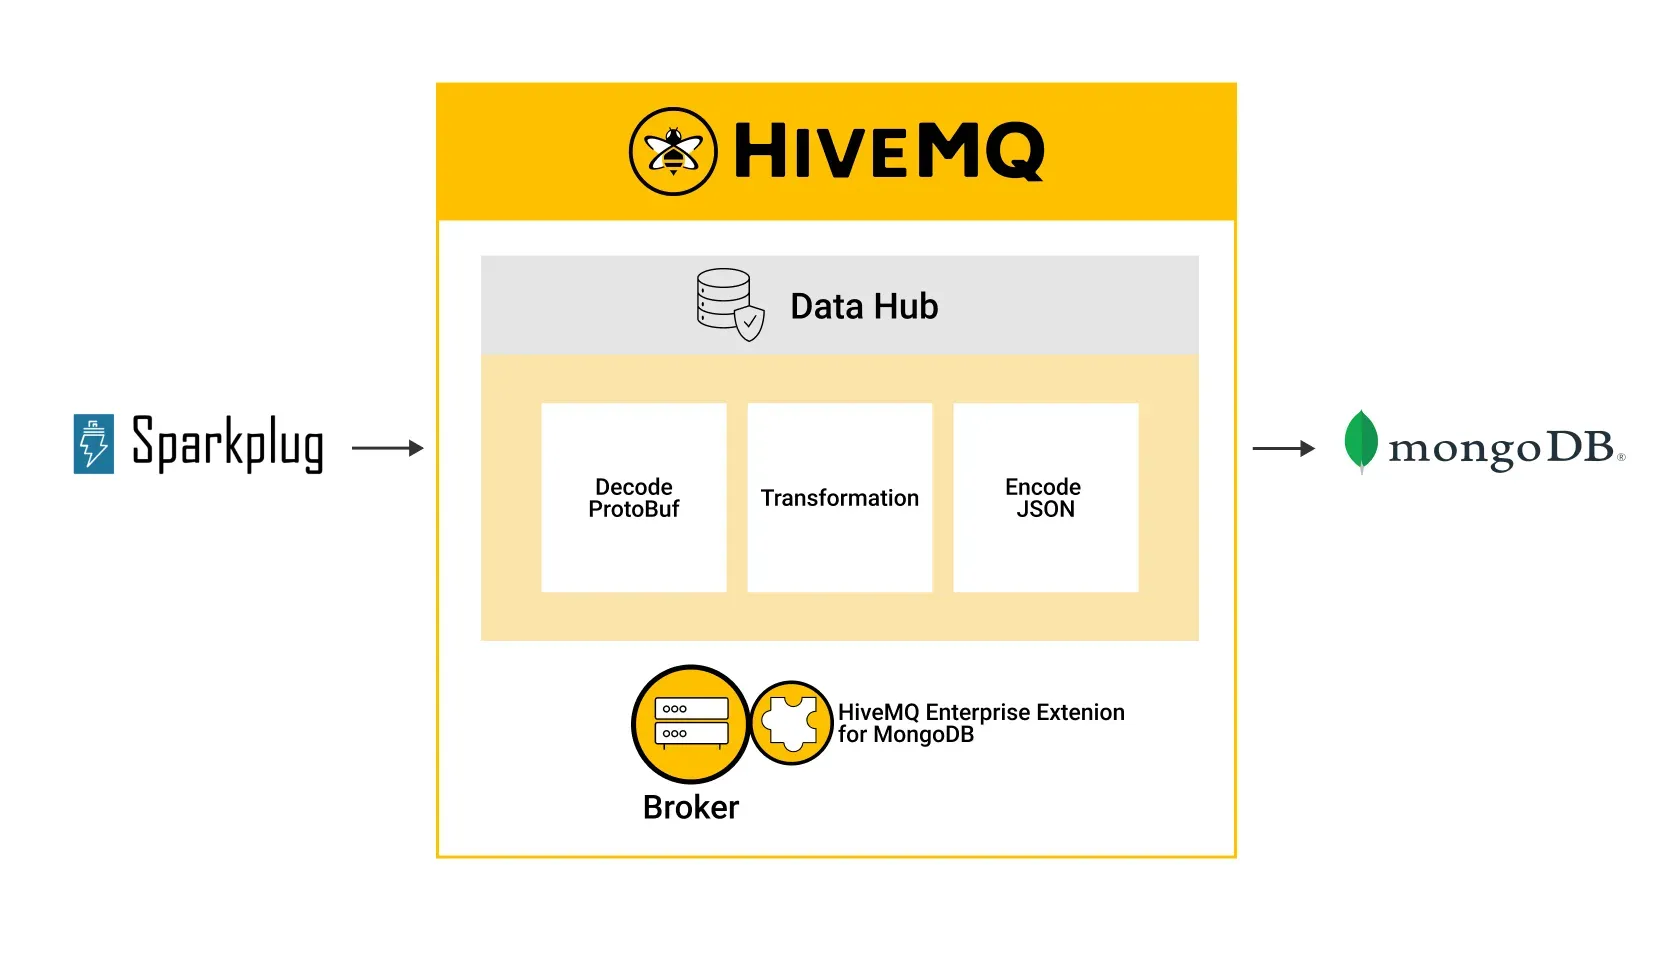 Figure 1: End-to-end architecture of the solution
Now, let’s look at each step in more detail:
The Broker receives MQTT Sparkplug messages from an IIoT device. When the Broker receives the MQTT Sparkplug message, Data Hub decodes (deserializes) the binary Protobuf format so it can process the message.
Using a Data Hub transformation script, we filter out the unwanted metrics from the data set. Often, a Sparkplug message contains hundreds or even thousands of metrics in a single message. However, only some metrics are useful. By doing this, we significantly reduce the data that the Broker forwards to the data consumer.
Data Hub creates new MQTT messages for each metric from the single Sparkplug message, often referred to as “fan out.”
After filtering the data, Data Hub encodes (serializes) the message into JSON format and publishes them to a sub-topic. We also convert the original message into JSON format.
Finally, we prepare the message so it can be sent to an IT application — in our case, MongoDB. To accomplish this, we use the HiveMQ Enterprise Extension for MongoDB to write the metrics to a database table.
Configuring the Data Hub Data Policy
To configure Data Hub, we first create a schema for the input Sparkplug Protocol Buffer data (for deserialization), a schema for the output JSON data format (for serialization), a transformation script, and a data policy to apply the schemas and the transformation script to the MQTT messages.
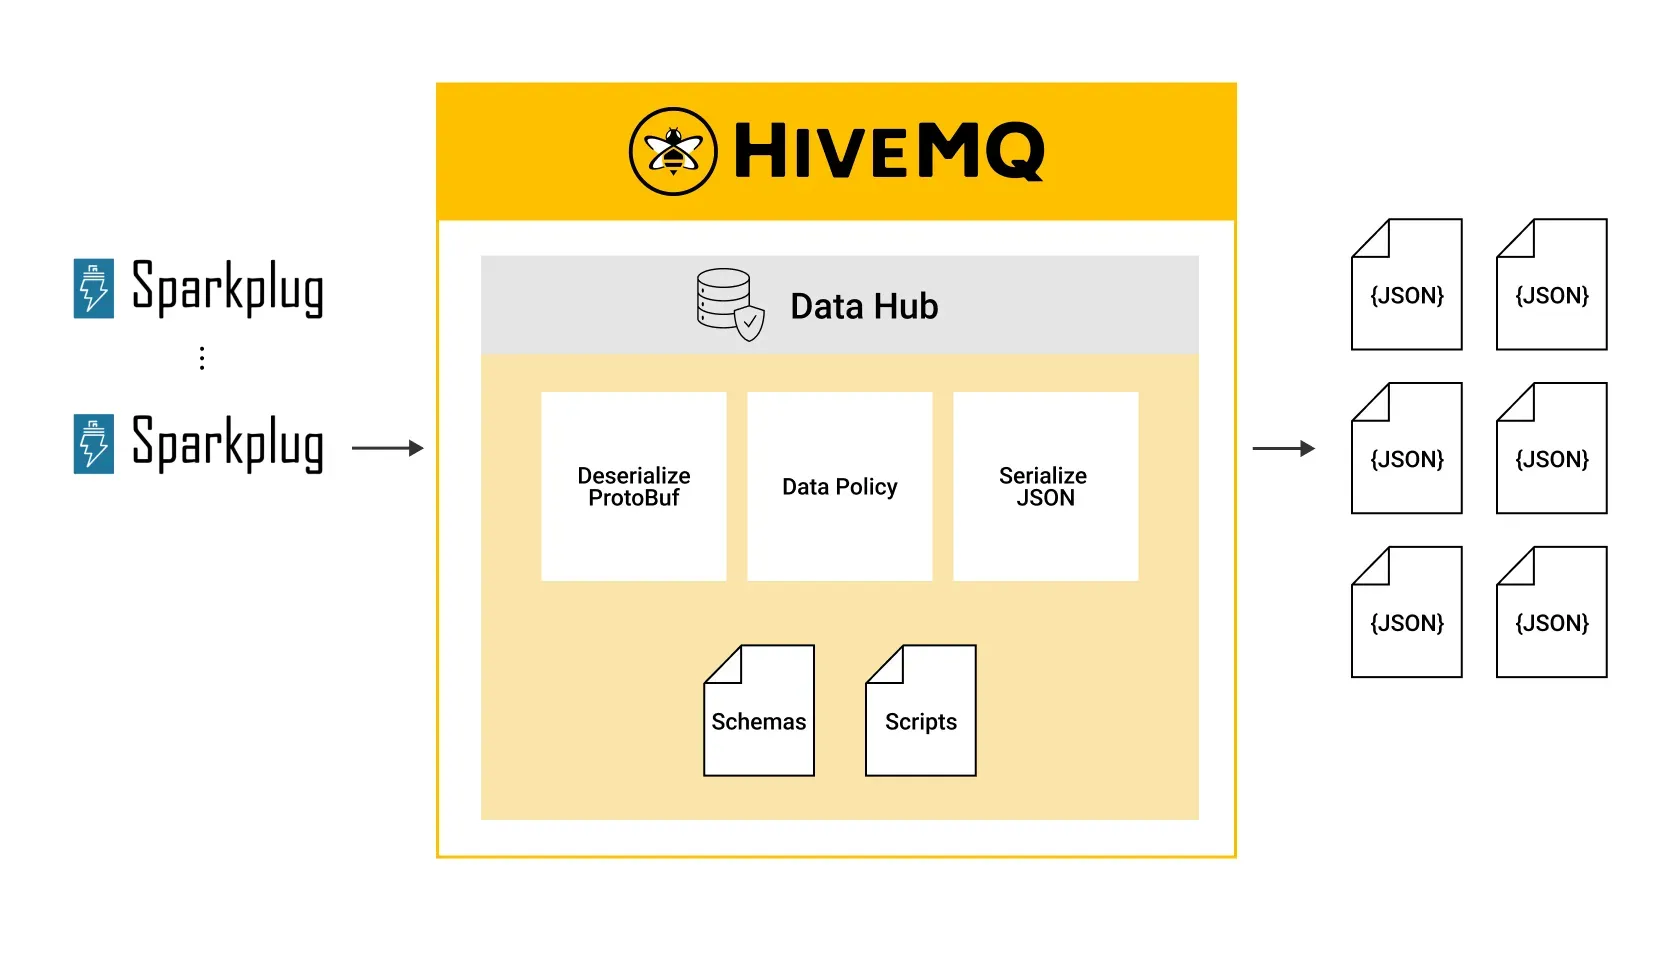 Figure 2: Protobuf to JSON conversion
Creating the Data Hub Schemas
For the Sparkplug Protobuf schema, we upload a protocol buffer descriptor file that describes the format of the Sparkplug messages so Data Hub can deserialize them. To learn more about creating a descriptor file from a protocol buffer schema definition, follow our documentation.
Our Sparkplug message consists of the following metric name structure:
machineis used for machine-related metrics,environmentis used for machine environmental data,performanceis used for performance-relevant data.
The IIoT device is publishing the metrics with the following names:
machine:voltage, machine:fan,environmental:temperature,environmental:humidity.
For our use case, we only want to fan out machine and performance as separate metric messages. However, we’ll come to this later in the blog post. 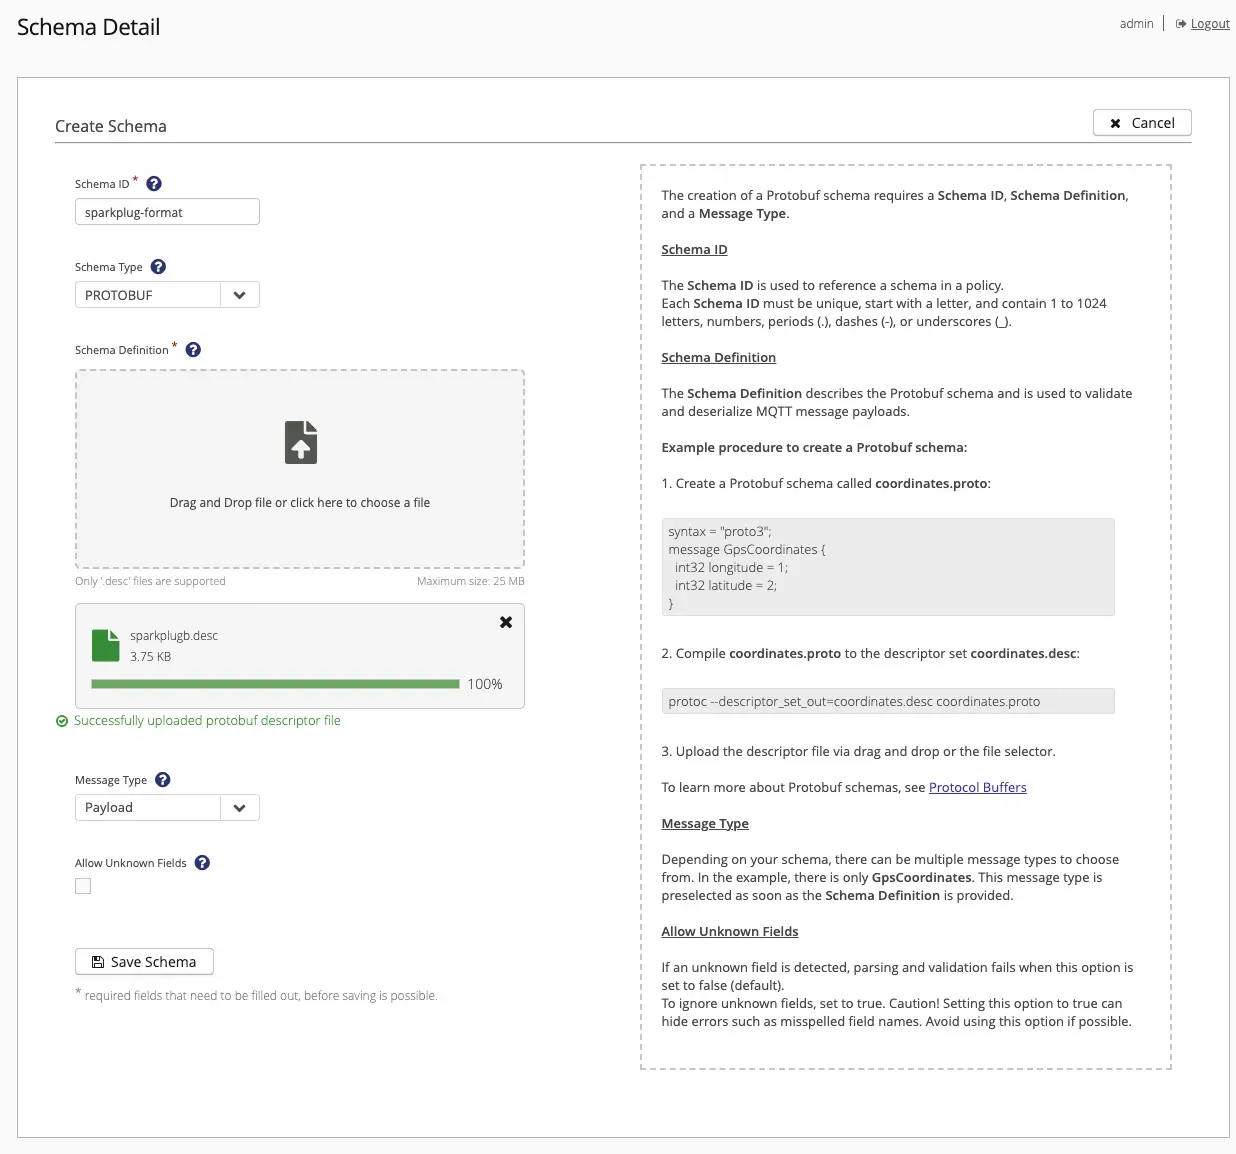 Figure 3: Create Sparkplug Protobuf Schema in the Control Center
For the output JSON schema, to keep this example simple, we’ll use the most basic schema, which is of the form {}. This describes a simple JSON schema that has no validation keywords and no constraints. In other words, anything is allowed. For your use case, it is likely that you’ll want to define a schema to accurately describe your data format. To learn more about how to create a JSON schema, refer to our documentation.
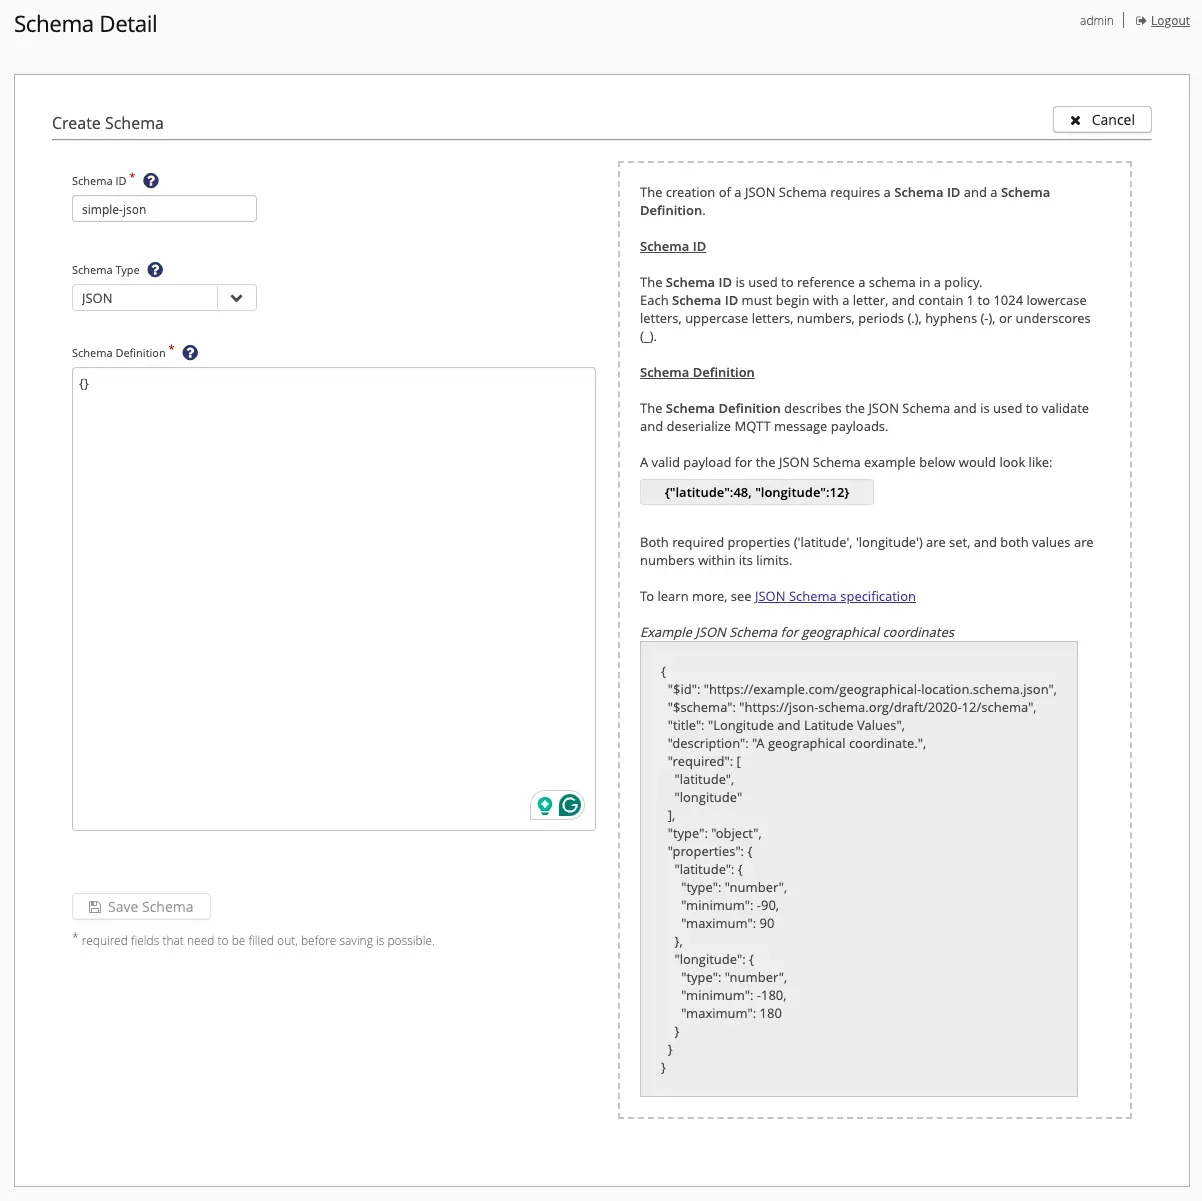 Figure 4: Create JSON schema in the Control Center
Creating the Data Hub Transformation Script
The Data Hub transformation feature enables you to add a custom JavaScript function to the Data Hub data policy where you can define the specific logic you need for your transformation. The script reads all of the metrics from a single Sparkplug message, publishes the original Sparkplug message, and publishes single metrics to a new MQTT topic (fan out). In our example, we want to publish each metric under a new sub-topic, so the script also changes the topic name. The script is shown below in Script 1.
function transform(publish, context) {
  const topic = publish.topic;
  const metrics = publish.payload.metrics;

  metrics
    .forEach((metric) => {
      const payload = metric;
      const newTopic = topic + "/" + metric.name;

      context.branches["metrics"].addPublish({
        payload: payload,
        topic: newTopic,
      });
    });

  return publish;
}
Script 1: Data Hub fan-out transformation function
The script defines a transform function, which is the entry point for every transformation function. The publish argument represents the MQTT publish object and the context object contains information provided by the Data Policy, such as arguments expressed as key-value pairs. To learn more about Data Hub Transformation functions, refer to our blogs Modify Your MQTT Data In-Flight with Data Transformation and Integrating ESP32 with LoRaWAN and HiveMQ MQTT Broker for Advanced IoT, or the Data Hub Documentation.
The function iterates over all the metrics of a single Sparkplug message and creates a new MQTT message for the single metric and a new topic. For each metric, a new MQTT message is created by calling the addPublish-function. To fan-out the messages to a new topic, all new messages are added to the metrics branch for serialization and publishing. The new topic is defined by the original topic concatenated with the metric name.
To add the script to Data Hub, we use HiveMQ’s Control Center, as shown in Figure 5 below:
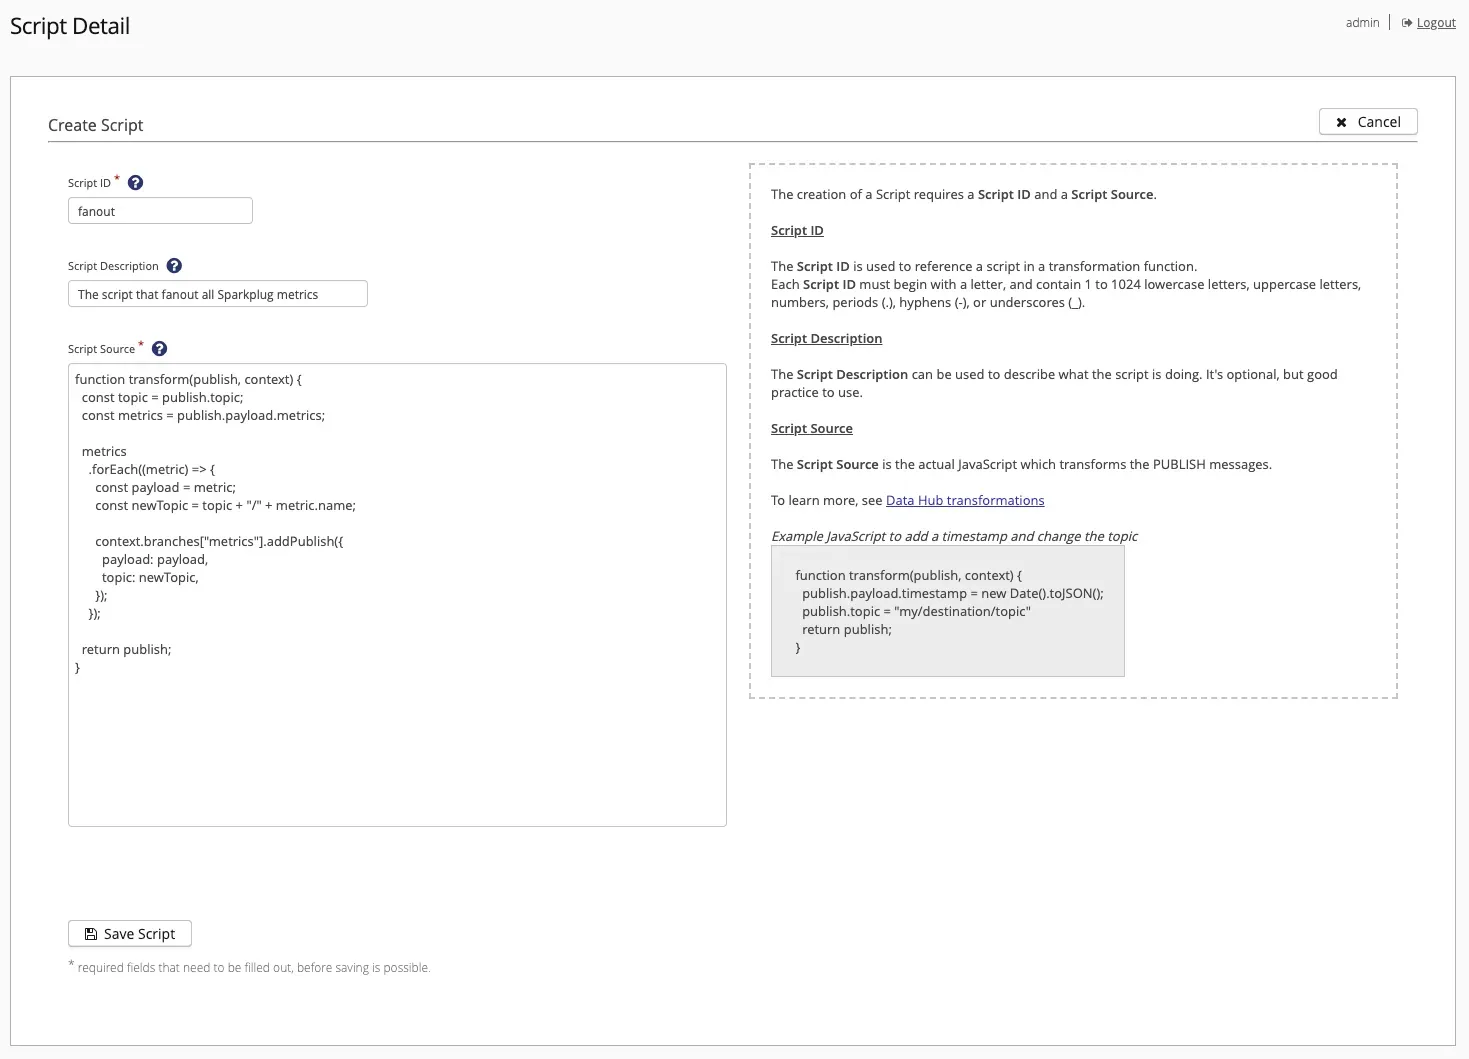 Figure 5: Create a transformation script in the Control Center
Creating the Data Policy
Now that you have created the schemas and the transformation script described above, we can move on to the data policy. Control Center simplifies this task by presenting a step-by-step wizard. Figure 6 shows the first step. Here, we give the data policy a policy id (protobuf-to-json-and-fanout) and a topic filter specifically for Sparkplug (spBv1.0/+/DDATA/+/+).
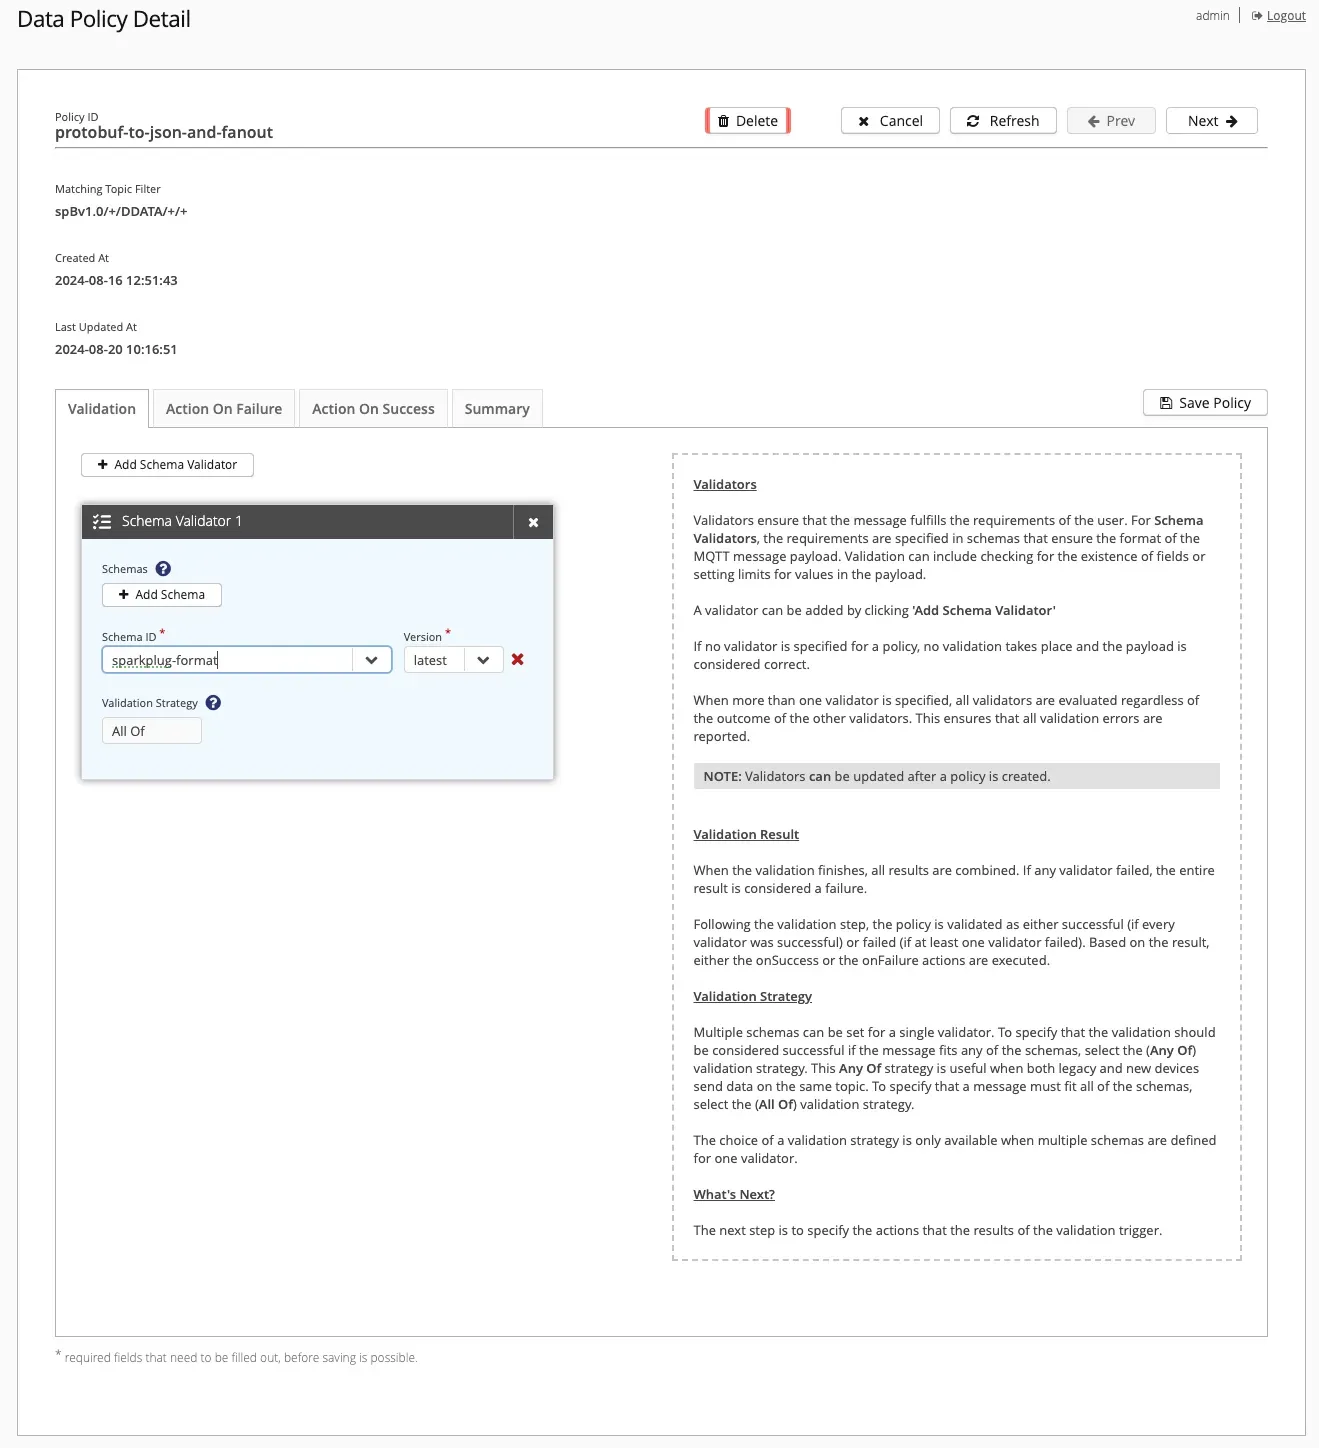 Figure 6: First page of creating a new data policy in the Control Center
In the second step, we create a pipeline of 3 tasks in the Action on Success tab that Data Hub will execute sequentially if the input messages are successfully validated against the data schema. The first task deserializes the incoming Sparkplug format (id=sparkplug-format). The second task executes the transformation script (id=fanout) and defines a metrics branch for serializing all fanout messages into the JSON schema (id=simple-json). Finally, the third task specifies the serialization of the original Sparkplug message into the JSON schema (id=simple-json). For your use case, you may want to configure a pipeline of tasks for Data Hub to execute on failure. However, to simplify this example, we only consider the successful path.
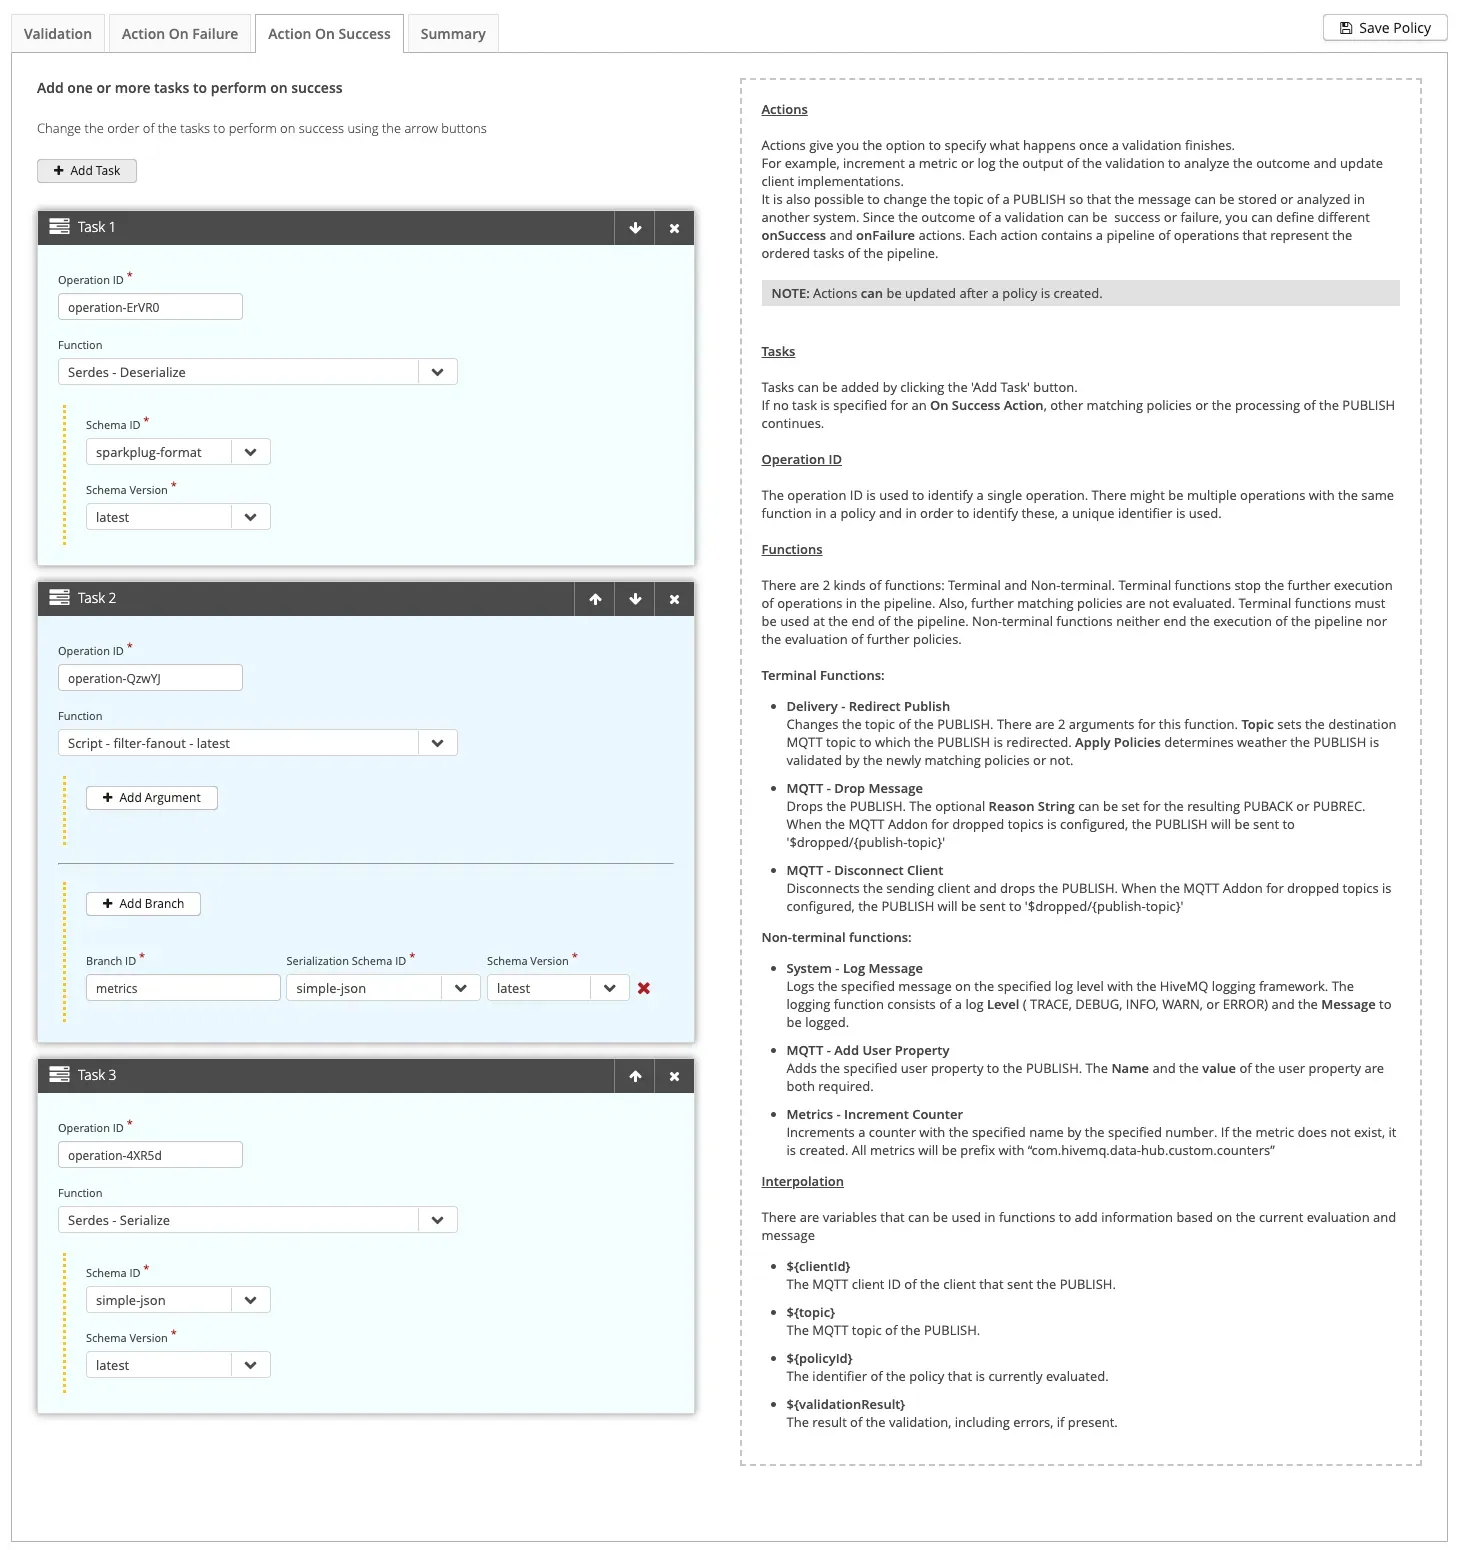 Figure 7: Action On Success page for the data policy in the Control Center
For the last step, click on the “Save Policy” button. Once saved, you’ll be presented with a summary page in the Control Center (Figure 8). You have now configured Data Hub which will handle and execute the steps described in the end-to-end architecture described earlier in this post.
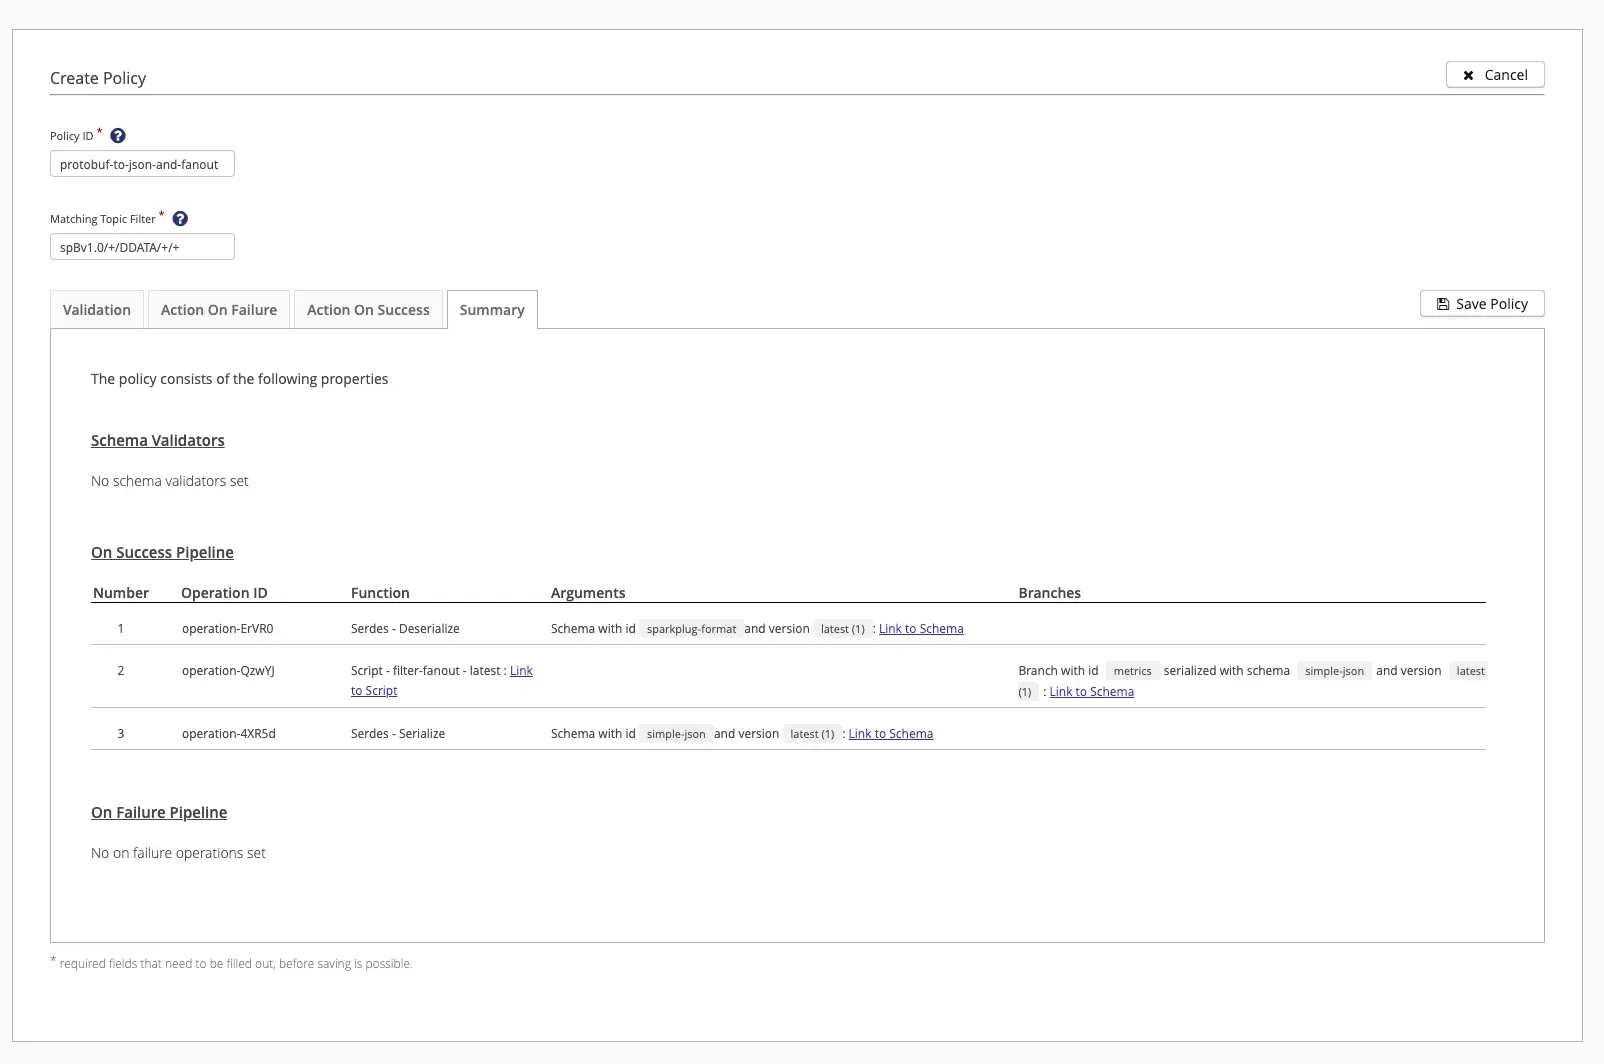 Figure 8: Summary page of the data policy in the Control Center
At this point, you can download the data policy in JSON format for closer inspection (Policy 1). Alternatively, for a more automated approach, you can also upload the JSON formatted data policy via the HiveMQ REST API.
{
"id" : "protobuf-to-json-and-fanout",
  "createdAt" : "2024-08-16T10:51:43.786Z",
  "lastUpdatedAt" : "2024-08-20T16:29:06.759Z",
  "matching" : {
    "topicFilter" : "spBv1.0/+/DDATA/+/+"
  },
  "validation" : {
    "validators" : [ {
      "type" : "schema",
      "arguments" : {
        "strategy" : "ALL_OF",
        "schemas" : [ {
          "schemaId" : "sparkplug-format",
          "version" : "latest"
        } ]
      }
    } ]
  },
  "onSuccess" : {
    "pipeline" : [ {
      "id" : "operation-ErVR0",
      "functionId" : "Serdes.deserialize",
      "arguments" : {
        "schemaVersion" : "latest",
        "schemaId" : "sparkplug-format"
      }
    }, {
      "id" : "operation-QzwYJ",
      "functionId" : "fn:filter-fanout:latest",
      "arguments" : {
        "allowList" : "machine,performance"
      },
      "onBranch" : [ {
        "branchId" : "metrics",
        "pipeline" : [ {
          "id" : "branch-serialize-sOZsS",
          "functionId" : "Serdes.serialize",
          "arguments" : {
            "schemaVersion" : "latest",
            "schemaId" : "simple-json"
          }
        } ]
      } ]
    }, {
      "id" : "operation-4XR5d",
      "functionId" : "Serdes.serialize",
      "arguments" : {
        "schemaVersion" : "latest",
        "schemaId" : "simple-json"
      }
    } ]
  },
  "onFailure" : {
    "pipeline" : [ ]
  }
}
Policy 1: The protobuf-to-json-and-fanout data policy
Filtering the Sparkplug Metrics
Update the Transformation Script
To future proof our transformation script, we’ll now create a function to validate the metrics to fan-out from an allow-list of metric names. So, if we change the list in the future, we won’t need to change the script.
Recall that we only want to fan-out the metrics machine and performance as separate messages. Based on this, we’ll update the transformation script and data policy as shown below.
function isValidMetricForFanout(metric, allowList) {
  for (let i = 0; i < allowList.length; i++) {
    if (metric.startsWith(allowList[i])) {
      return true;
    }
  }
  return false;
}

function transform(publish, context) {
  const topic = publish.topic;
  const metrics = publish.payload.metrics;
  const allowList = (context.arguments.allowList || "").split(",");

  metrics
    .filter((metric) => isValidMetricForFanout(metric.name, allowList))
    .forEach((metric) => {
      const payload = metric;
      const newTopic = topic + "/" + metric.name;

      context.branches["metrics"].addPublish({
        payload: payload,
        topic: newTopic,
      });
    });

  return publish;
}
Script 2: The protobuf-to-json-and-fanout data policy with an allow-list
The script contains two functions isValidMetricForFanout and transform. Let’s look at the transform function first. You’ll see that we’ve added the variable allowList , which contains the contents of the allowList. The context object contains an additional object called arguments, which contains the arguments defined in the data policy. We will add this shortly in Control Center. For now, let’s assume that the context object contains an argument called allowList, which is a comma-separated list of type String.
The default behavior is to use all the Sparkplug metrics if no arguments are defined in the data policy. So, if the context object contains no arguments, then the allowList will be an empty string represented as “”. The result is split by “,” (comma) into an array of strings representing the metric prefixes to be allowed for fanout.
Now, let’s look at the helper function isValidMetricForFanout.The function has two arguments: the metricName and the list of allowed prefixes, allowList. The function iterates over all elements of allowList and checks whether the metric starts with that element. If yes, then the metric is allowed, and the function returns a true. Otherwise, it returns a false.
Next, from the Control Center, navigate to Data Hub -> scripts and click on “Add New Version” to create a new version of the transformation script (Figure 8). When you do this, you’ll notice that the script’s version number will be incremented by one; Data Hub automatically keeps track of all your transformation script versions.
When you update the data policy in the next step, you’ll notice that you can choose which version of the script to use. In fact, you can reuse the same script across multiple data policies. For instance, imagine multiple industrial sites publishing MQTT data to a central HiveMQ Broker. If each site emits different metrics, you can efficiently manage the data from each source by creating namespace-specific policies with different allowlists.
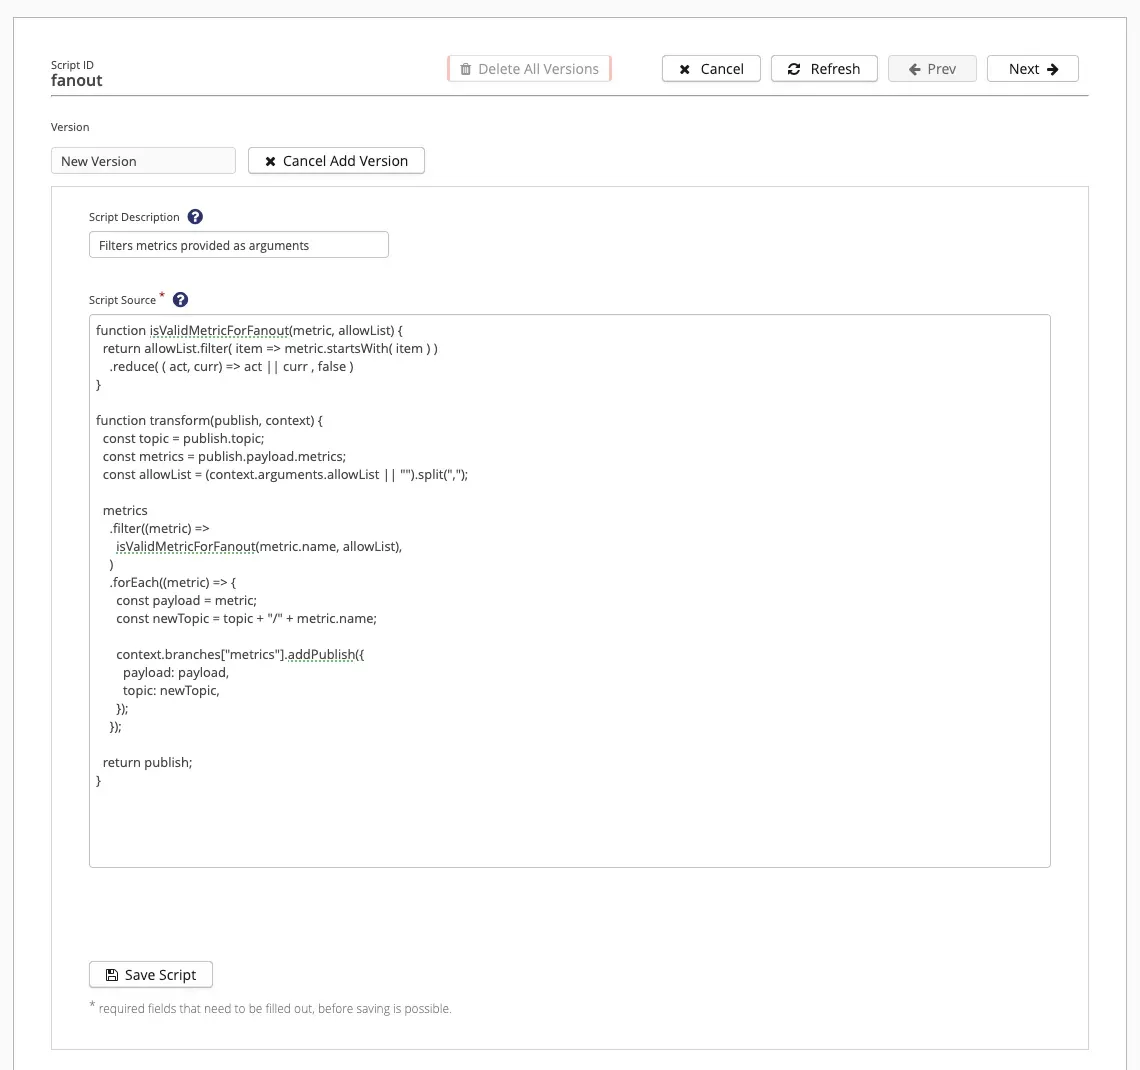 Figure 9: Add a new version of the script in the Control Center
Next Steps
In summary, we covered how to convert an MQTT Sparkplug message into JSON format using HiveMQ Data Hub, and distribute metrics to the original topic prefix with the metric name appended.
In the next part of this series, Sending Filtered MQTT Sparkplug Messages to MongoDB for IIoT Data Transformation: Part 2, we'll demonstrate a method for passing arguments from the data policy to the transformation script, allowing us to filter out unnecessary Sparkplug metrics. We'll also utilize the HiveMQ MongoDB Extension to send the data to a MongoDB database. Read on.
Explore our HiveMQ Data Hub, and take a look at our GitHub Cookbooks for more examples of how to use Data Hub.
Navigate this series:

Stefan Frehse
Stefan Frehse is the Director of Engineering at HiveMQ. He earned a Ph.D. in Computer Science from the University of Bremen and has worked in software engineering and in c-level management positions for 10 years. He has written many academic papers and spoken on topics including formal verification of fault tolerant systems, debugging and synthesis of reversible logic.

Eric Henderson
Eric Henderson was a Senior Product Manager at HiveMQ, with extensive experience in both start-ups and big tech. Specializing in IoT, AI-driven software, speech recognition, and InsureTech, Eric excels in guiding products from inception to maturity, collaborating across teams to innovate and deliver solutions.
