Cracking MQTT Performance with Automation: Benchmarking Implemented
In part 1 of this blog series, Cracking MQTT Performance with Automation, we discussed the challenges that HiveMQ engineers had to solve on the thorny path of introducing automated system benchmarking and the benefits that they and the customers reap as a result. In this blog, we will discuss the implementation of automated system benchmarks and how they help with the performance testing of an MQTT broker.
Automated System Benchmarks: Salvation for Performance Testing of MQTT Broker
HiveMQ’s solution to the manifold of performance challenges, ranging from unreliable public benchmarks to noisy neighbours in cloud deployments, emerged over a course of a few months. It is called automated system benchmarks.
System benchmarks are a collection of tooling around automated benchmarking and benchmark cases that represent customer workloads. Engineers use system benchmarks both during development and quality assurance. On the development stage, system benchmarks are used as a design aid helping engineers to quickly iterate over the countless solution alternatives and select the best one. On the quality assurance stage the aim is different. There, the system benchmarks help to spot performance regressions on the production code, before they hit the customer, thus guaranteeing that the system will not perform worse.
Automated system benchmarks can be executed in various cloud environments thanks to Terraform. In this segment we’ll keep our focus on the AWS platform that is widely used by the HiveMQ customers.
An Overview of Automated System Benchmarks
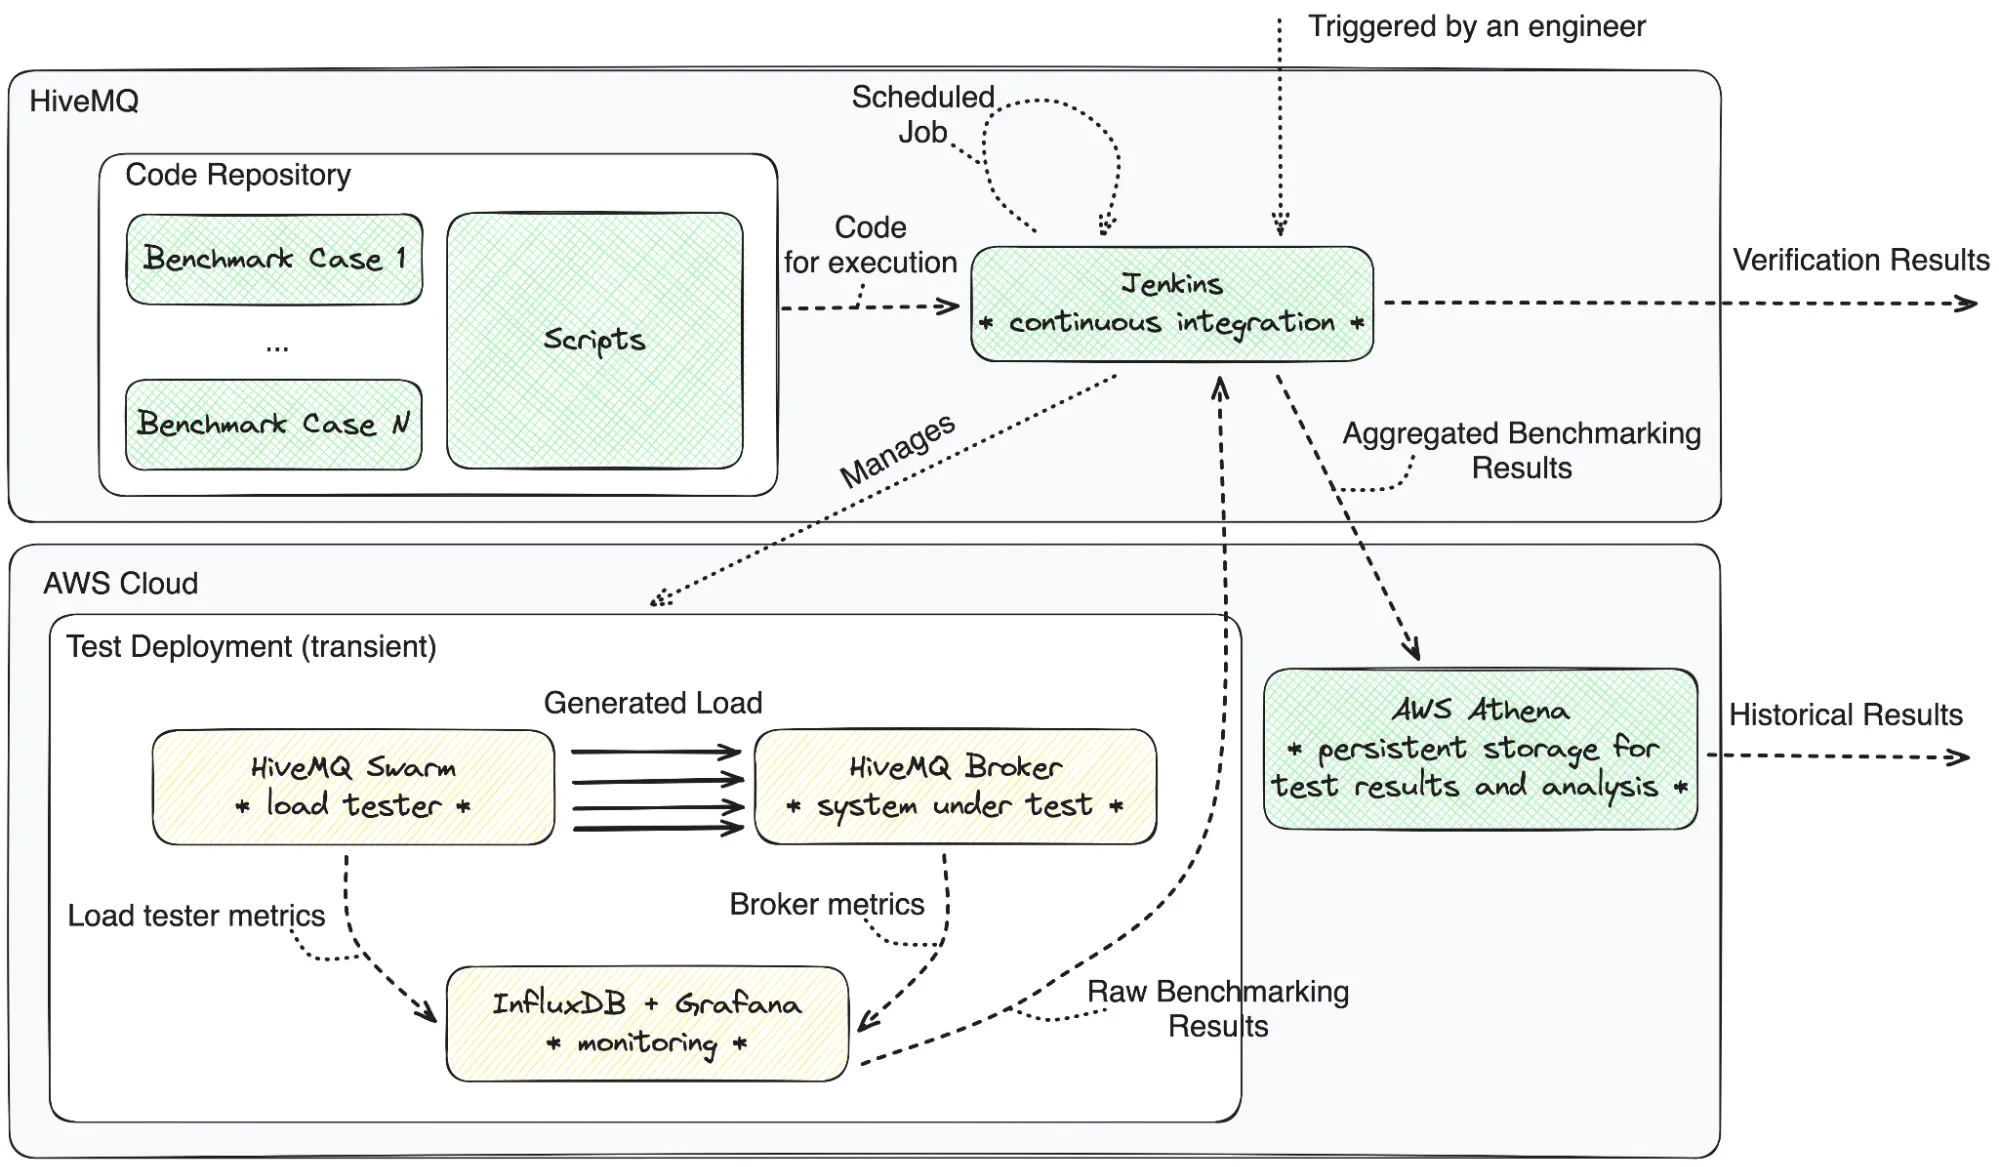
System benchmarks span two organizational domains - that of AWS (cloud provider) and that of HiveMQ.
The HiveMQ domain contains system benchmarks code repository and an automation server running Jenkins. The code repository contains both the automation scripts (mostly written in Python) to manage, aggregate, and verify the results of the performance tests as well as the benchmark cases. Each benchmark case includes three components: a list of metrics to evaluate, the Terraform configuration to deploy (notably, VM types and their count, as well as the MQTT broker configuration), and the HiveMQ Swarm scenario. The HiveMQ Swarm scenario specifies the stages of the test that will be executed during load generation. To learn more about HiveMQ Swarm, check its product page. In a nutshell, this load tester reads the script file, creates and manages the clients driving them through multiple stages, such as connecting, subscribing, publishing, unsubscribing, and disconnecting, with occasional conditional checks.
The AWS domain houses the test deployment and the persistent store for historical data. The test deployment exists only temporarily, while the experiment still runs. Once the experiment is over, the test deployment is teared down completely to avoid resource waste. The test deployment includes the deployment for the load testing tool (HiveMQ Swarm), the deployment for the tested MQTT broker (HiveMQ Broker), and the monitoring infrastructure (InfluxDB with Grafana). Both the load testing tool and the MQTT broker run on multiple virtual machines, whereas monitoring is okay with just one. Even though the test deployment is teared down after each run, the results are extracted by automation, then processed and verified, and then added to the test results history in AWS Athena.
The below figure shows the organizational domains in gray. Big white boxes group connected elements of the code repository and test deployment correspondingly. The green boxes represent entities that perpetually exist, whereas the yellow ones are the transient entities.
Triggering System Benchmarks
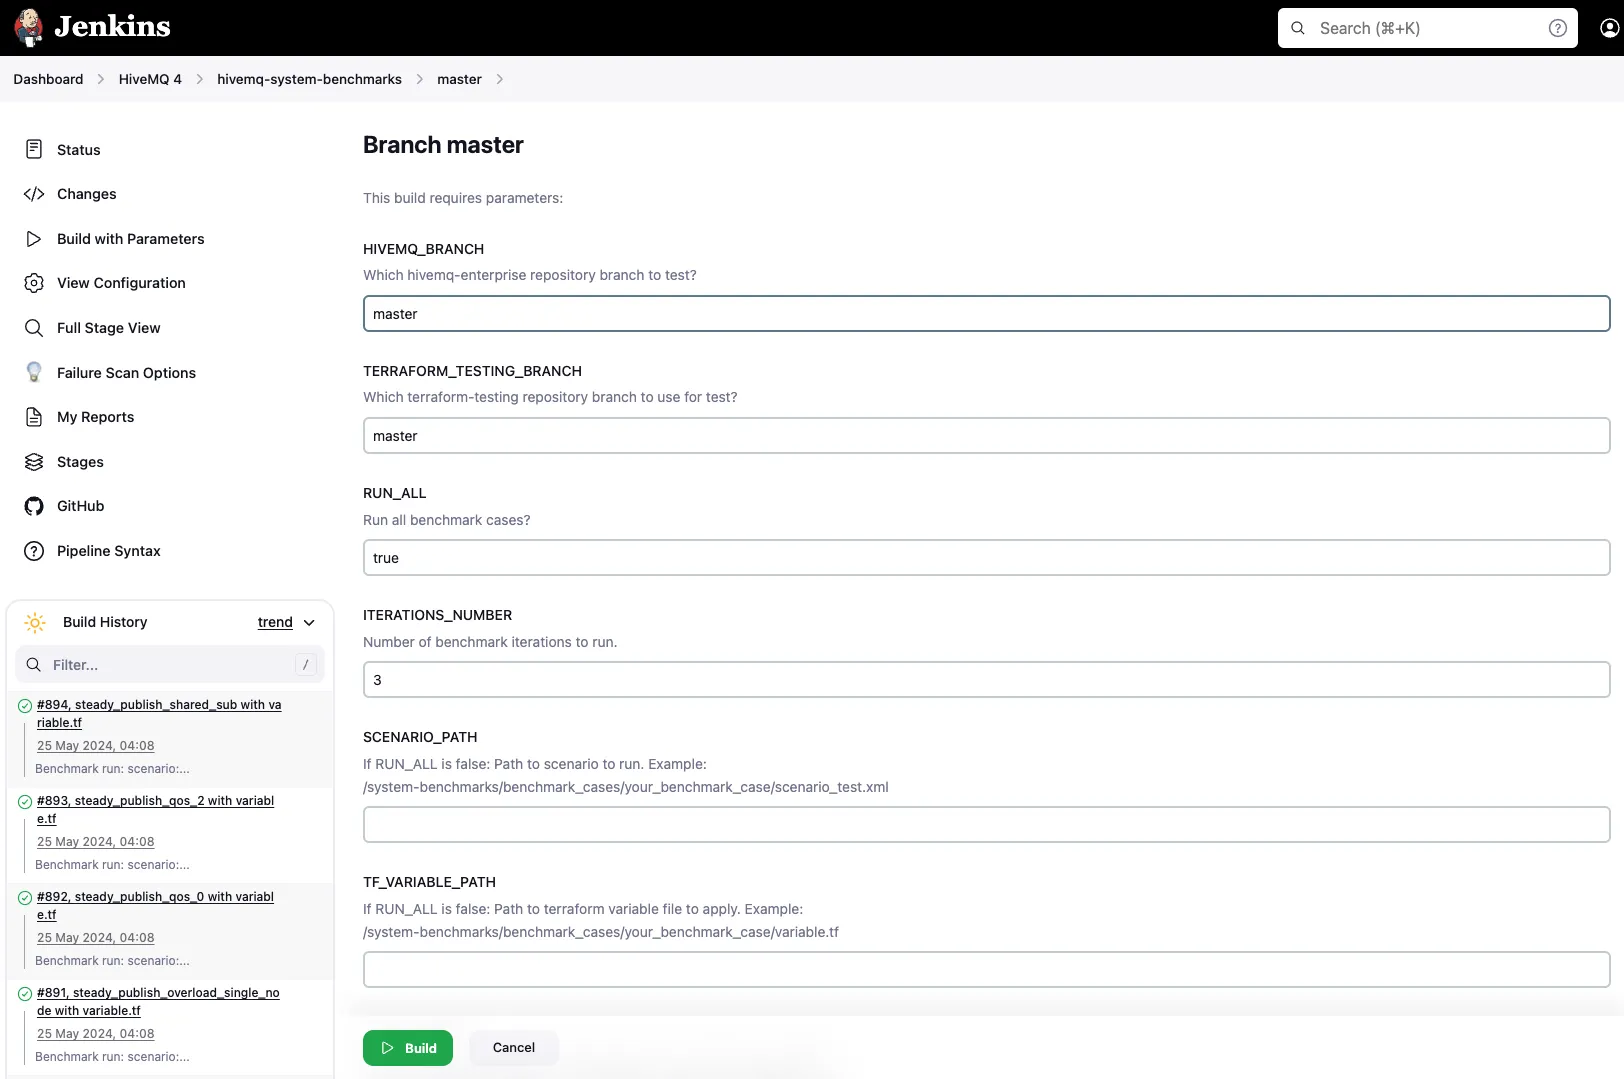
There are multiple ways to trigger system benchmarks. We do so sparingly at HiveMQ. If the change does not touch any performance-critical components, then there is no need to run a full-fledged performance test. But, if there is a need, then one can manually trigger the corresponding Jenkins job which is as simple as directing Jenkins to the right branch, specifying the desired iterations number and scenario details (if needed) and hitting the BUILD button.
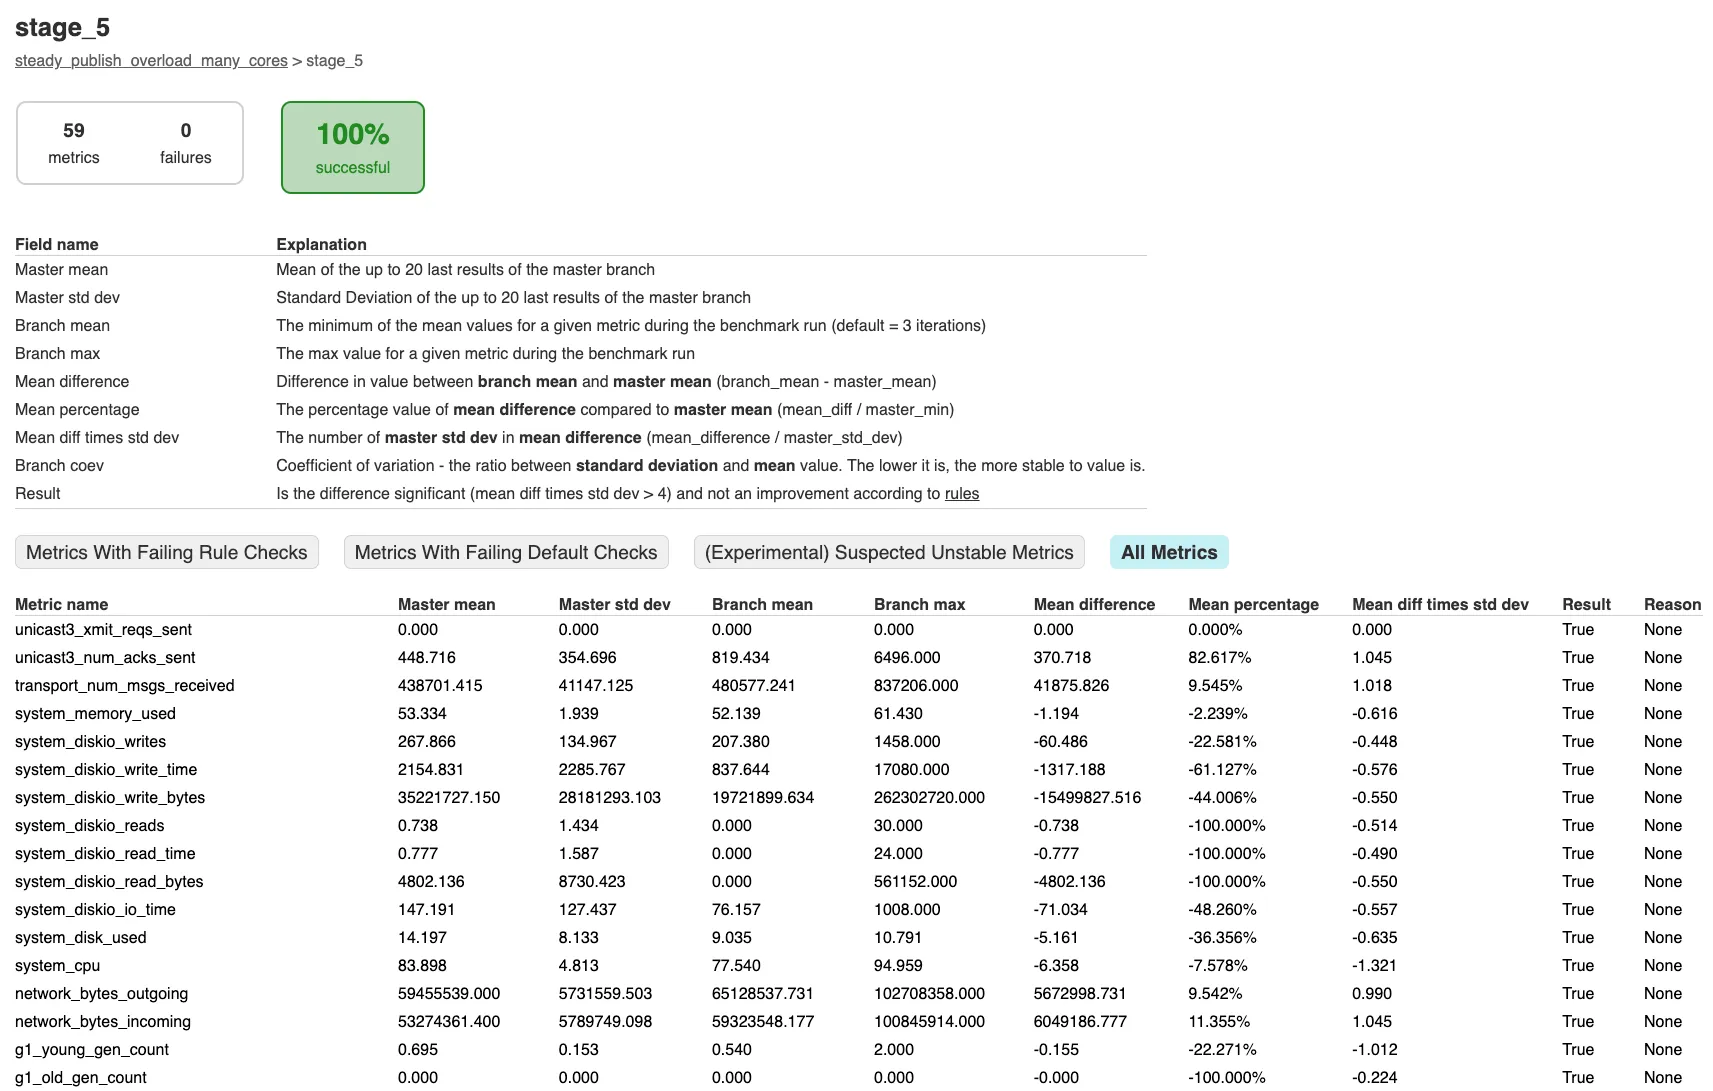
The report for the system benchmarks run will contain a table with all the relevant metrics and some values. If a certain metric fails verification, then it will be marked in red. If it demonstrates higher-than-expected performance, then it is highlighted in green, otherwise, it will be in plain black color like all the metrics in the example screenshot below.
Even if the engineers do not trigger system benchmarks, they still run twice a week on a scheduled job on the master branch. Such a safety net allows to detect possible performance regressions early, before the release.
System Benchmarks: Collection and Aggregation
To ensure that the collected performance results represent system behavior, Jenkins runs every benchmark case multiple times. The exact number is up to the engineer, but the default number is three[1]. Adhering to the highest quality assurance standards, a standalone test deployment is created and destroyed for every benchmark case execution.
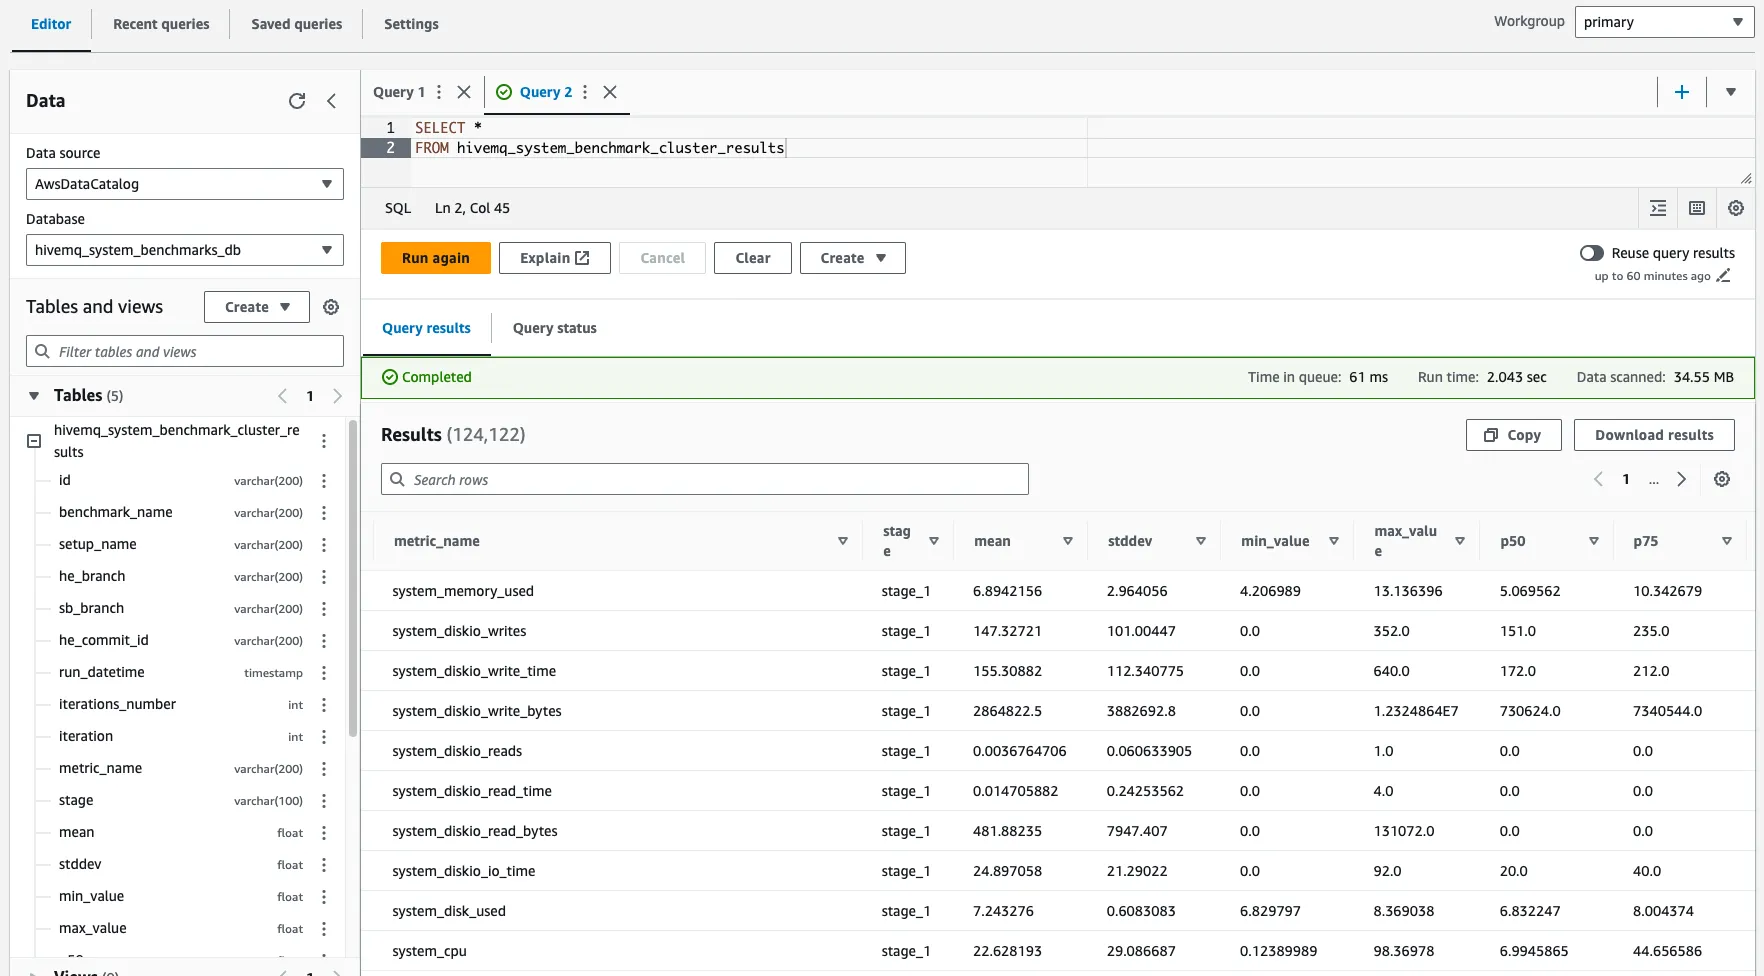
Before destroying the test deployment, Jenkins, which runs automation scripts, collects the relevant metrics specified in the benchmark case into plain CSV files. Once all the executions of the benchmark case are complete, the results are aggregated for all the iterations. We apply all kinds of aggregations to the results, varying from computing the plain mean to percentiles and standard deviations. Once the whole run of system benchmarks is over, the files are shoved into AWS Athena for ‘permanent storage’. There, the engineers can extract the aggregated performance results and analyze them using querying capabilities of Athena (see the screenshot below).
 Case Complete: Omni-Benchmarking an MQTT Broker
I mentioned that HiveMQ system benchmarks contain multiple benchmark cases. Each benchmark case focuses on a particular aspect of the system behavior, be it a specific MQTT quality of service level, some sizing of VM instances, or a certain load pattern. Sometimes, the aspects are combined.
Together, the benchmark cases comprise something I call omni-benchmarking. This made-up word characterizes a capability to achieve completeness in assessing performance of an MQTT broker. This is an important characteristic of system benchmarks because not only does MQTT protocol offer a variety of tuning knobs such as QoS levels, subscription types, and expirations, but the setups as well as the load patterns and volumes differ wildly across industries that bring their use cases into HiveMQ MQTT Platform.
Let’s dive into core benchmarking cases covering the infamous 80% of scenarios[2] that HiveMQ Platform faces in production. The following testing dimensions are at play when synthesizing such benchmarks:
types of instances (many cores vs conventional amount of cores);
number of instances (small deployments or large deployments);
message distribution pattern (one publisher to one subscriber, fan-in with many publishers to one subscriber, and fan-out with one publisher to many subscribers);
kind of subscription (exclusive or shared);
message payload size (small or large);
quality of service level (QoS0, QoS1, and QoS2);
load pattern (flash crowd with publish spikes or steady);
primary evaluated characteristic (latency test or throughput test).
Idle Connections case assesses the capability of a single HiveMQ node to establish one million connections over a period of six minutes. Although not maxing out the broker, this test serves as a safety net to prevent regressions in the amount of connections that HiveMQ Broker node can routinely handle.
PUBLISH fan-in case assesses the capability of a four-node HiveMQ cluster to fan in PUBLISH packets of 30,000 publishing clients at a total incoming rate of 30,000 PUBLISH packets per second into a mere ten subscriptions. This case provides insights into performance of the outbound message delivery subsystem of HiveMQ Broker.
PUBLISH fan-out case is the opposite of fan-in. It also runs on the same AWS deployment configuration with four nodes. This time, though, each PUBLISH packet produced by a group of 200 publishers is fanned out by the broker into queues of 250 subscribers. This gory case is a valuable tool to zoom into performance of the inbound message distribution subsystem of HiveMQ Broker.
PUBLISH spikes case. Some customers (predominantly in the connected cars segment) are exposed to sharp load increase and decrease. This benchmark case is an attempt to capture exactly that situation by a short-lived test. Twenty thousand publishers push their load to twenty thousand subscribers in five short batches of 10,000 MQTT packets per minute. The case allows the engineering team to assess how the broker softens the impact of the sharp load changes and bounces back from the stress.
Steady Supply of Large PUBLISHes case. PUBLISHes with payload of 5, 10, and 100 KiB are not unheard of in the world of JSONs and MQTT Sparkplug. Multiple writes of large payloads to disk may affect performance due to hardware limitations of the stable storage (one of the slowest kinds of computer resource). To offer high durability and reliability, HiveMQ relies on stable storage for client data. This case sends a total of 125,000 messages of 10 KiB each (per second) allowing the engineers to catch bottlenecks in the storage subsystem of the broker.
PUBLISH overload scenario cases is a family of scenario cases unified by the idea to drive the broker to its limit. Although the precise load is different for every scenario, the unifying concept is to push as much load as possible onto the broker, enough to max out the CPU resource and activate the backpressure. These benchmark cases primarily differ amongst each other by the number of nodes that they use. One of the scenarios uses three high-end c6a.8xlarge nodes, another one - twelve less pricey c6a.2xlarge instances, and there is also a middle ground configuration with four c6a.2xlarge nodes. Additionally, an overload scenario for a single instance c6a.2xlarge enables engineers to spot the regressions that do not depend on clustering subsystems.
Additional benchmark cases focusing on MQTT features, such as QoS levels and shared subscriptions are useful to spot regressions along the lesser traveled data flow paths. They are a nice addition to the more general purpose benchmarks listed above.
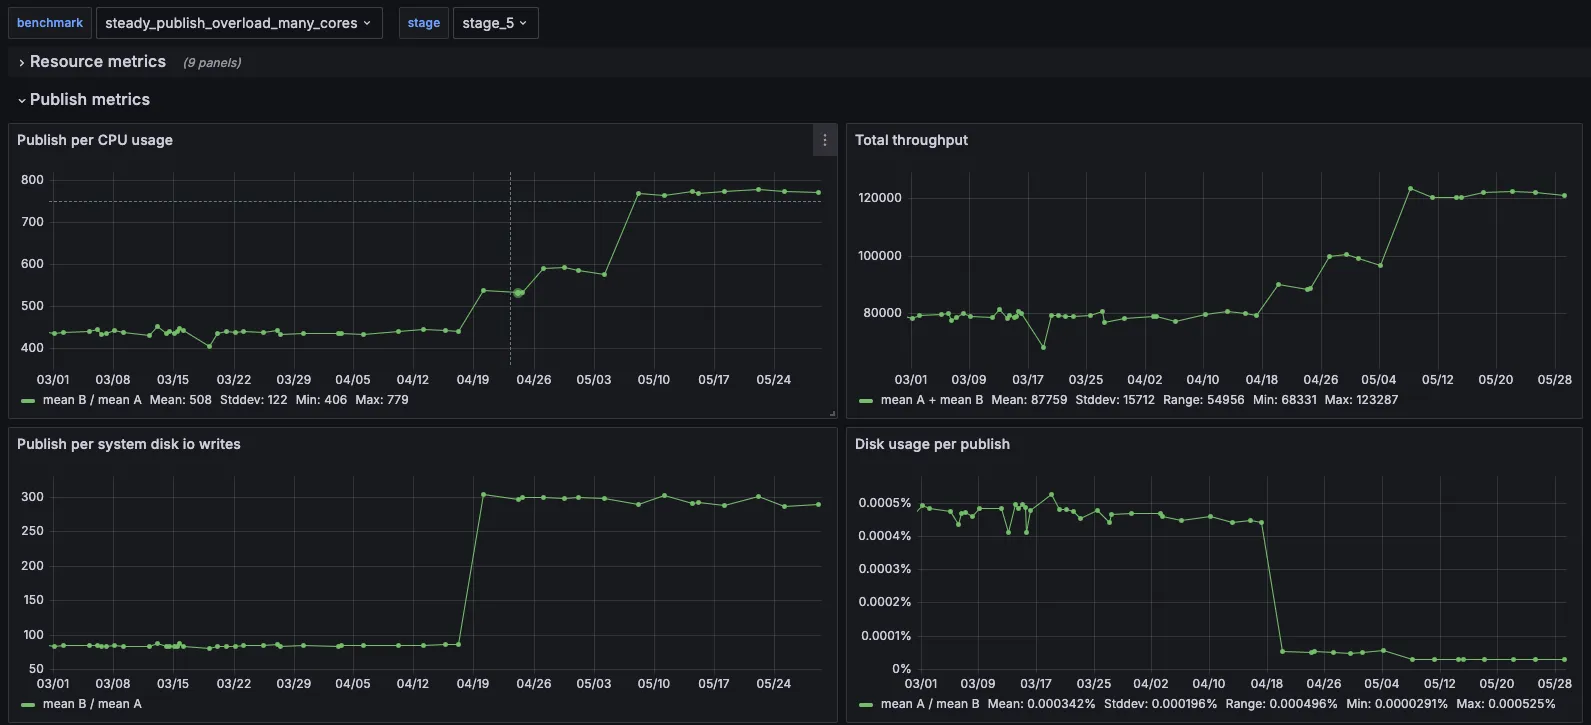
The abundance of the benchmark cases makes the comparison between their historical results difficult. HiveMQ engineers have addressed this challenge by collecting the system benchmarks results in HiveMQ Performance Mission Control Center. In a nutshell, this is a Grafana dashboard that visualizes the results of automated system benchmarks over time. Seeing the dips and surges in just a handful of graphs allows one to quickly diagnose the health of the new broker version and gain visibility across multiple versions. Below is a screenshot for one of the many benchmark cases where we can see how HiveMQ broker efficiency improved on many-core EC2 instances.
End-to-End Performance Mindset:What You Test is What You Improve
Building software from zero to one presents a completely different set of challenges than getting it from one to two and onwards. HiveMQ Platform is long past the zero-to-one stage where the engineering intuition played a deciding role. Having acquired customers and delivered on their expectations, HiveMQ now pays close attention to continuously improving performance of its core product, HiveMQ MQTT Broker.
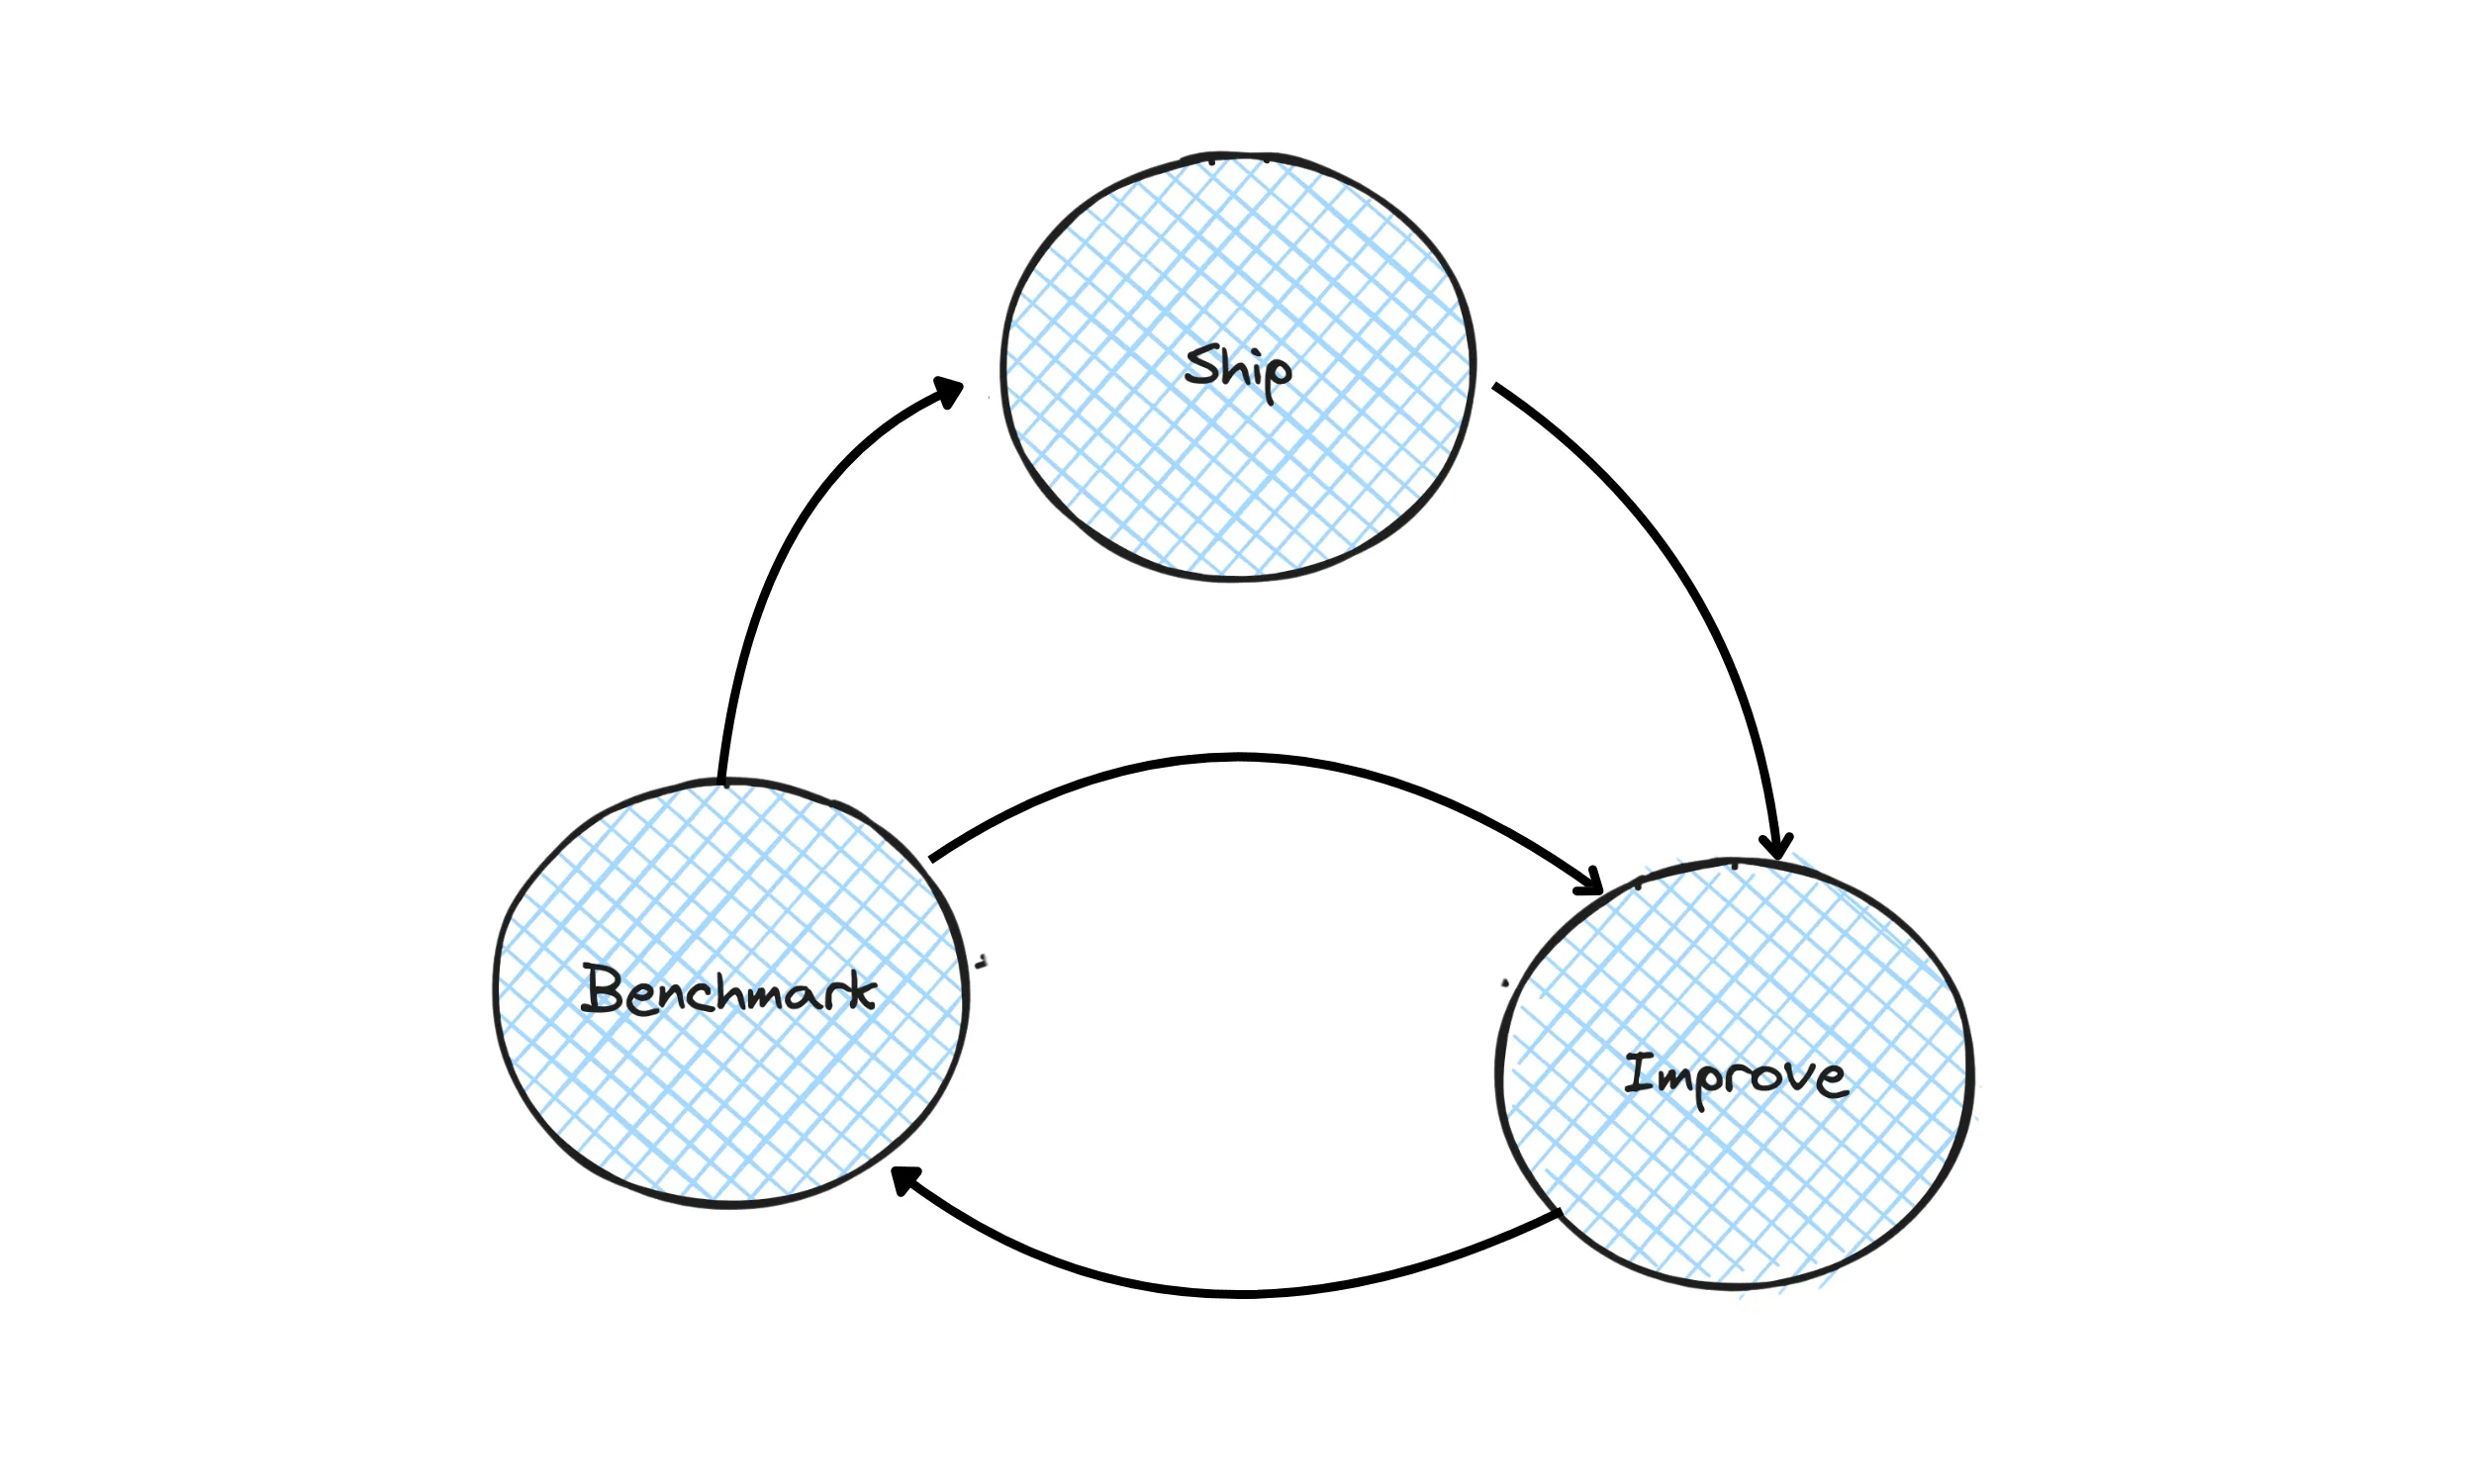
The improvements are no longer driven by intuition but by data. Automated benchmarking is like a flashlight, highlighting the next component of the broker to improve. It is not always possible to determine what to improve with benchmarking data alone, but, as any coarse diagnostics tool, it still helps to select the initial candidates for improvement. Engineers can then obtain a clearer picture with more fine-grained tooling, such as CPU and lock profiling. Once the issue is understood, HiveMQ engineers design, implement, and verify the solution. The improved version is again benchmarked and, likely, shipped. Then, the cycle goes on.
 Automated performance benchmarks with wide coverage of setups and scenarios allow HiveMQ to continuously improve performance to the benefit of all the customers. System benchmarks have gained significant traction across the HiveMQ teams and are being continuously refined by adding rare scenarios and building up more automation.
Incorporating automated system benchmarks into HiveMQ development and quality assurance pipeline does help to deliver more performant software at a higher pace. To drive the quality standards even higher, HiveMQ engineers augment this powerful tool with their own expertise and insights collected over years of building and operating the highly available distributed MQTT broker. This synergetic approach to performance improvements is something that allows HiveMQ to set the highest standards in MQTT broker technology and to continuously earn the trust of its customers.
References
[1] The number is selected by a fair three-sided coin toss. Of course, this is a joke. This number is, in fact, a compromise between getting more stable results and not increasing our carbon footprint.
[2] I’m referring to the Pareto principle here. The remaining 20% of benchmarking cases will be added over time taking, most likely, not less than 80% of the team effort.

Dr. Vladimir Podolskiy
Dr. Vladimir Podolskiy is a Senior Distributed Systems Specialist at HiveMQ. He is a software professional who possesses practical experience in designing dependable distributed software systems requiring high availability and applying machine intelligence to make software autonomous. He enjoys writing about MQTT, automation, data analytics, distributed systems, and software engineering.
