Enhanced APM Solution with HiveMQ Distributed Tracing and Azure Application Insights
The HiveMQ Distributed Tracing Extension uses an open standard, OpenTelemetry-based, enterprise-grade approach to add tracing capabilities to the HiveMQ MQTT Platform. In unison, logging, monitoring, and tracing make your HiveMQ MQTT broker fully observable.
The Distributed Tracing Extension enables MQTT visibility into the Application Performance Monitoring (APM) solution of your choice. With the HiveMQ Enterprise Distributed Tracing Extension, you can see exactly how long the HiveMQ MQTT Broker takes to process a request.
The insights you gain from the extension help you eliminate gaps in your APM solution, speed up your root-cause analysis, impact your mean time to resolve (MTTR), and increase the mean time between failures (MTBF) across your entire distributed architecture.
This blog guides you through setting up the HiveMQ Distributed Tracing Extension, more specifically on a HiveMQ K8s platform deployed in Azure AKS and integrated to Azure’s APM, Application Insights via OTel collector setup.
For further information about the OpenTelemetry specification, click here. Find background information on Azure Application Insights in the Azure documentation here.
Setup of HiveMQ Distributed Tracing Extension
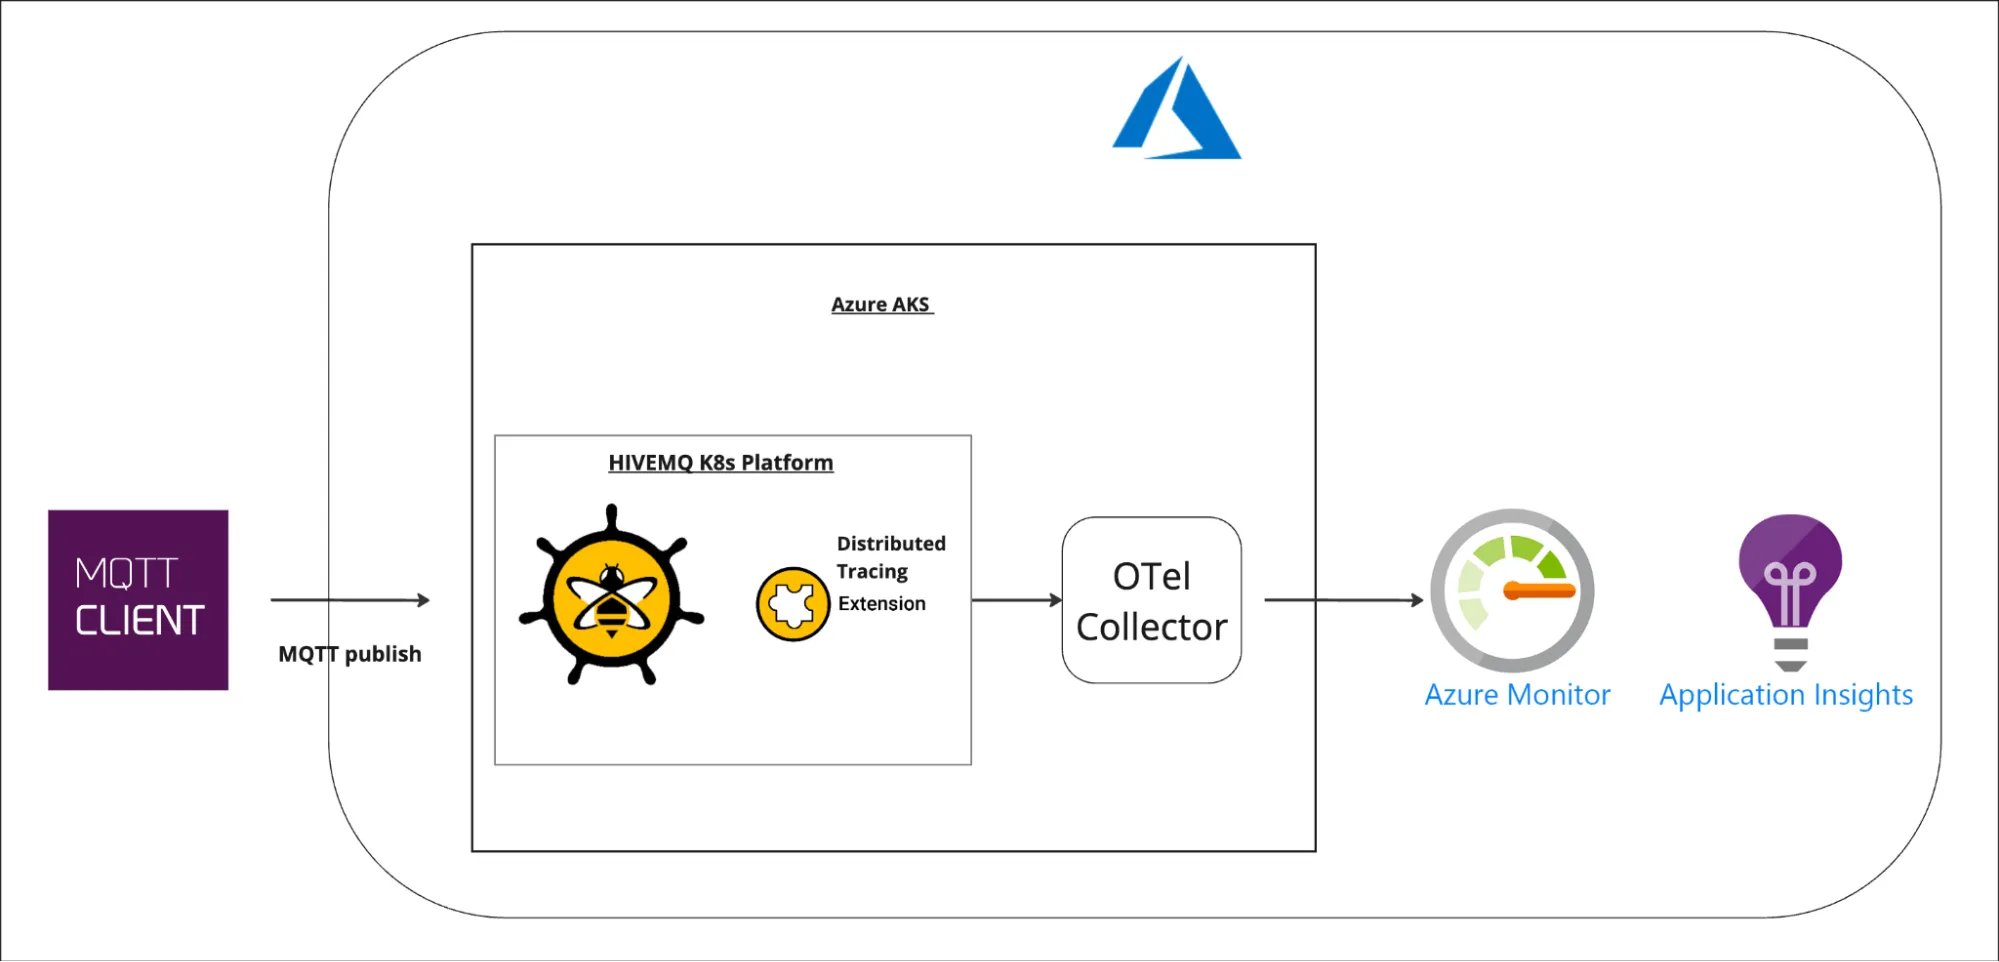
The following sections walk you through the setup of HiveMQ Distributed Tracing Extension to provide network traces to an OTel collector, which will be the interface to Azure Application Insights as shown in the diagram below.

Prerequisites:
A HiveMQ platform (MQTT broker) — in this example, it is deployed on an AKS cluster. The same setup could also be done with HiveMQ deployed in a VM or container.
Application Insights instance set up on your Azure instance.
Setup of the Distributed Tracing Configuration
1. Below is a sample of the distributed tracing config.xml that will need to be added as configMap for the HiveMQ K8s platform. Note that the batch span processor values are set up for testing and can be adjusted accordingly. Get more details on HiveMQ Distributed Tracing Extension Configuration.
<?xml version="1.0" encoding="UTF-8"?>
<hivemq-distributed-tracing-extension xmlns:xsi="http://www.w3.org/2001/XMLSchema-instance"
                                      xsi:noNamespaceSchemaLocation="config.xsd">
    <service-name>HiveMQ Broker</service-name>

    <propagators>
        <propagator>tracecontext</propagator>
    </propagators>

    <batch-span-processor>
        <schedule-delay>5000</schedule-delay>
        <max-queue-size>2048</max-queue-size>
        <max-export-batch-size>512</max-export-batch-size>
        <export-timeout>30</export-timeout>
    </batch-span-processor>

    <exporters>
        <otlp-exporter>
            <id>my-otlp-exporter</id>
            <endpoint>http://otel-collector:4317</endpoint>
            <protocol>grpc</protocol>
        </otlp-exporter>
    </exporters>
</hivemq-distributed-tracing-extension>
2. Create a configMap for the Distributed Tracing Extension configuration
Link to sample config.xml of the extension:
kubectl create configmap distributed-tracing-config --from-file=config.xml=config.xml -n <namespace> Set Up and Deploy the OTel Collector
Here’s the link to get otel-collector-values.yml
The following yaml file “otel-collector-values.yml” has the manifest for deployment of the OTel collector. You will need to modify it to enter your Azure Application Insight endpoint information.
Update with your namespace
Update the Azure Application Insight connection_string
1. Gather the Azure Application Insight connection_string
In order to gather the connection_string information, login to your Azure instance, navigate to the Application Insight that is set up and to the Overview section.
Copy the Connection String information as highlighted in the screenshot below.
 With the Connection String information copied, you will only require part of it for the OTel Configuration input, which will be the InstumentationKey and IngestionEndpoint URL information.
InstrumentationKey=<AZ Application Insight Key>;
IngestionEndpoint=<AZ Ingestion Endpoint URL>
2. Update the OTel Collector Values with the following highlighted below pertaining to your environment.
metadata:
  name: otel-collector-conf
  namespace: [namespace]
  labels:
    app: opentelemetry
    component: otel-collector-conf
data:
  otel-collector-config: |
    receivers:
      # Make sure to add the otlp receiver.
      # This will open up the receiver on port 4317
      otlp:
        protocols:
          grpc:
            endpoint: "0.0.0.0:4317"
    processors:
    extensions:
      health_check: {}
    exporters:
      azuremonitor:
        connection_string: "InstrumentationKey=[AZ Application Insight Key];IngestionEndpoint=[AZ Ingestion Endpoint URL]"

    service:
      extensions: [health_check]
      pipelines:
        traces:
          receivers: [otlp]
          exporters: [azuremonitor]
Within the services, update the namespace:
apiVersion: v1
kind: Service
metadata:
  name: otel-collector
  namespace: [namespace]
  labels:
    app: opentelemetry
    component: otel-collector
Within Deployment, update the namespace:
apiVersion: apps/v1
kind: Deployment
metadata:
  name: otel-collector
  namespace: [namespace]
  labels:
3. Deploy the OTLP collector on your AKS cluster.
kubectl apply -f otel-collector-values.yml -n <namespace>Deploy Distributed Tracing Extension
1. Update your platform-values.yaml file with enabling the Distributed Tracing Extension and referencing the configMap set up earlier.
 - name: hivemq-distributed-tracing-extension
    extensionUri: preinstalled
    # Disable the extension (enabled=false), to secure your deployment.
    enabled: true
    supportsHotReload: false
    configMapName: distributed-tracing-config
2. Update your hivemq-platform to run with enablement of the HiveMQ Distributed Tracing Extension.
3. Verify OTLP pods services are deployed successfully and the HiveMQ Distributed Tracing extension as well.
4. Perform some tests:
Connect any MQTT client of your choice to HiveMQ Broker.
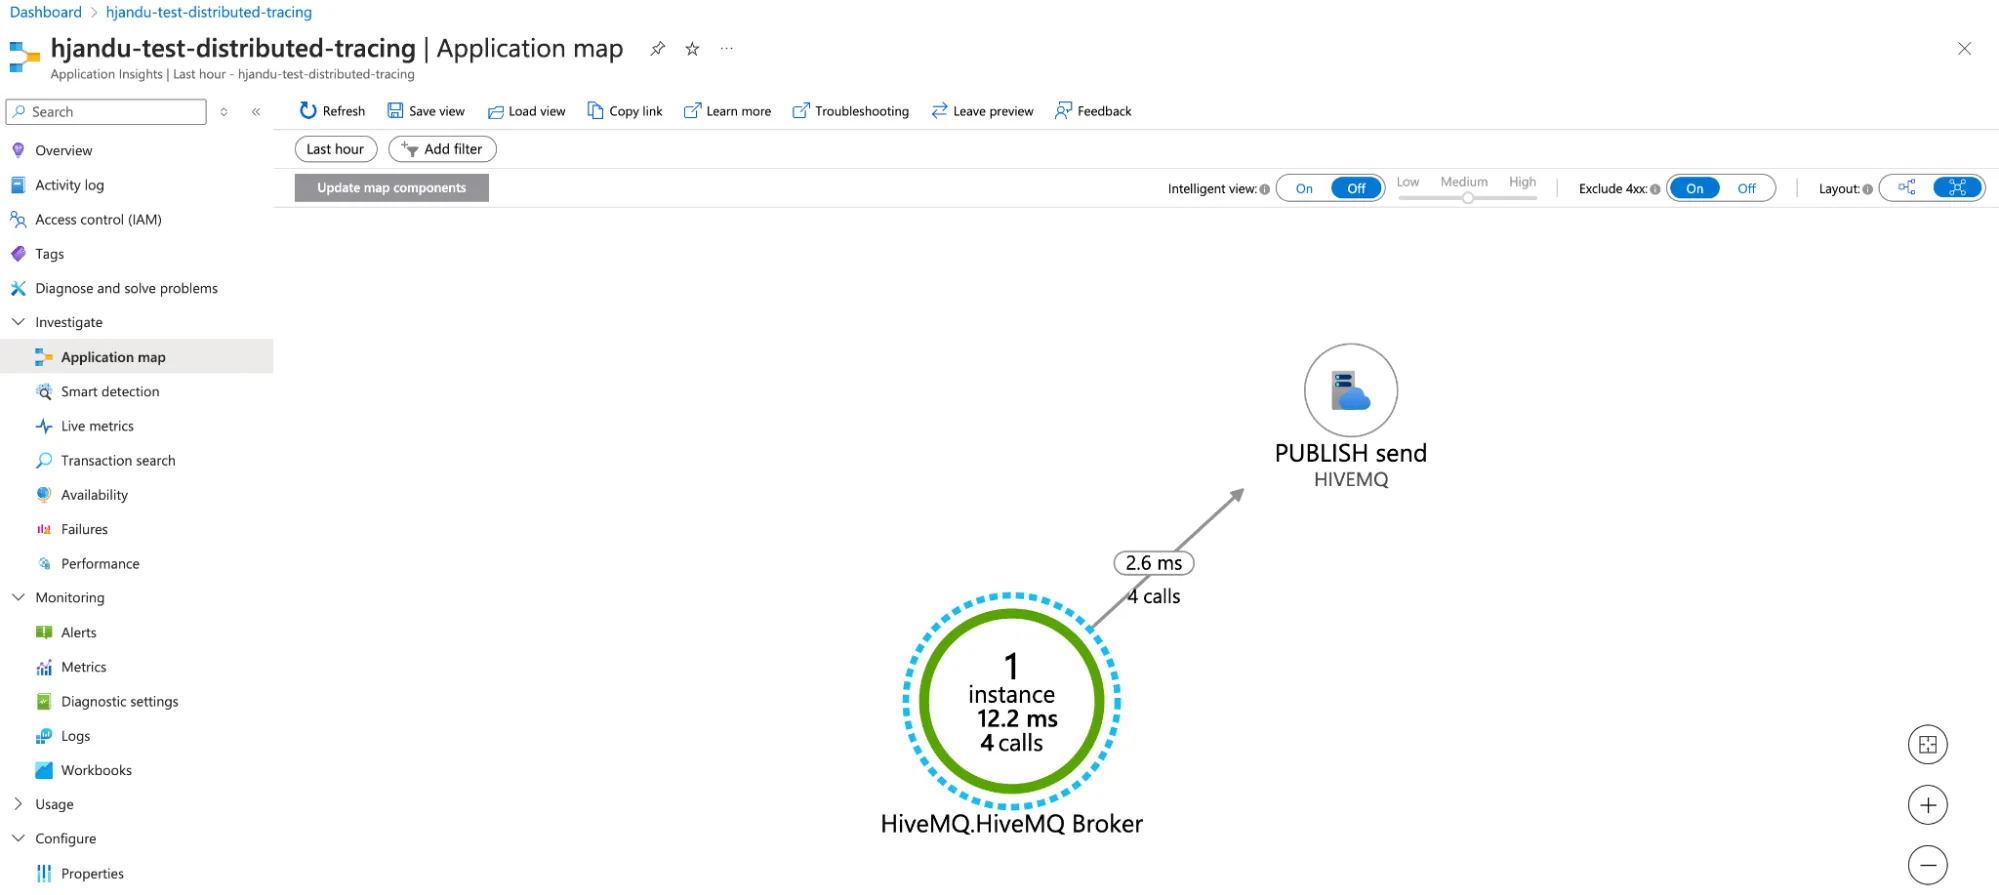
Publish MQTT messages from the client, and you will see tracing information in the Application Map of AZ Application Insight as shown in the example below.

Summary
By setting up the HiveMQ Distributed Tracing Extension, more specifically on a HiveMQ K8s platform deployed in Azure AKS and integrated with Azure’s Application Performance Monitoring (APM) solution, Application Insights, using the OTel collector setup, you can achieve:
Enhanced Observability: Gain full visibility into your MQTT broker's performance with integrated logging, monitoring, and tracing.
Seamless APM Integration: Effectively connect your MQTT broker's tracing data with Azure Application Insights, allowing for precise performance monitoring and analysis.
Improved Performance Management: Utilize detailed tracing information to streamline root-cause analysis and improve mean time to resolve (MTTR), while also increasing the mean time between failures (MTBF) for your distributed systems.
Get HiveMQ Enterprise Distributed Tracing Extension.

Harminder Jandu
Harminder Jandu is a Solution Engineer at HiveMQ. Harminder helps enterprises with their IoT digital transformation activities using HiveMQ Enterprise MQTT platform. His background is in IoT and Communications across multiple specialities, which includes solution engineering, customer success, and consulting.
