How to Connect a Smart Factory and Visualize IIoT Data with MQTT Sparkplug
In a smart factory and smart manufacturing ecosystem, integrating and sharing data between heterogeneous systems and services is a huge challenge. One way to overcome this challenge is adopting MQTT Sparkplug open-source IoT specification in the hardware systems and the edge devices. For the reason that, Sparkplug provides MQTT clients the framework to seamlessly integrate industrial data across the entire ecosystem of hardware vendors and application providers, like SCADA, MES, and Historian vendors, within the MQTT infrastructure in a bi-directional and interoperable way.
Through a series of blog posts, we will demonstrate how easy it is to connect different Industry 4.0 products using MQTT Sparkplug B specification and HiveMQ Cloud MQTT broker, and use the generated IIoT data for making quick and better business decisions.
Getting Hands-on with MQTT Sparkplug: A Simple Demonstration
In Part 1 of this series, we will connect an edge device on the plant floor, such as Opto 22 groov Rio using HiveMQ Cloud MQTT broker that supports MQTT Sparkplug B specification and then forward the data to Canary Cloud for analysis. For those unaware, Canary is a process data historian solution that allows you to collect, store and use visual tools to contextualize the data. This data helps in making better business decisions and thus maximizing your operations. Canary offers a wide range of mechanisms to collect data from industrial devices and PLCs such as Opto 22‘s groov Rio, one of which is using the MQTT protocol.
For this demonstration in particular, we will simulate a minimalistic smart factory set up as shown in the image below. Here, we will collect process data, such as temperature, pressure, and liquid level of a Cooling Tower from Opto 22 groov Rio.
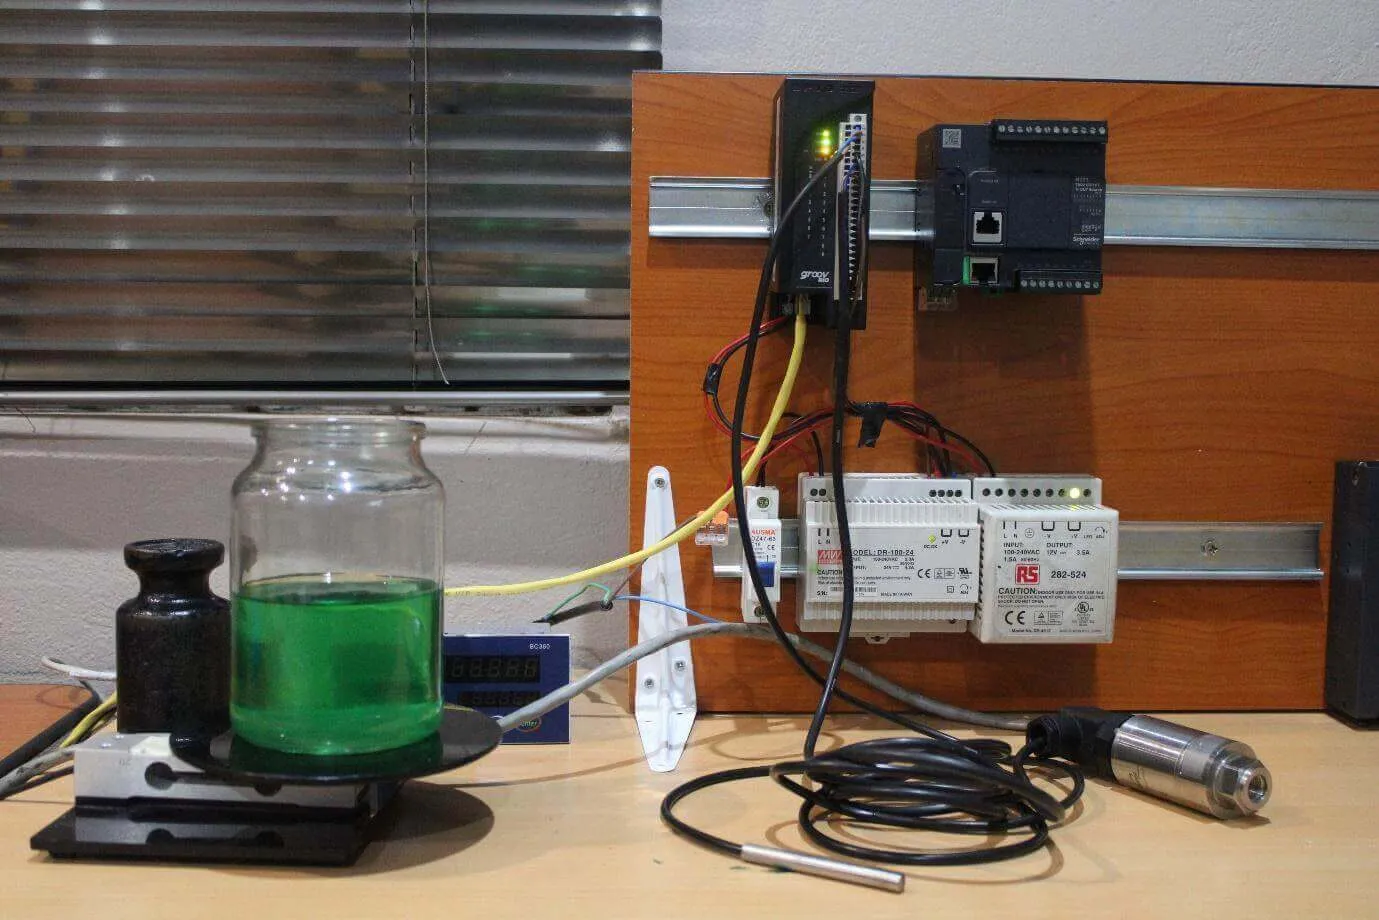 Image 1: Hardware Setup Simulating a Minimalistic Smart Factory
The Power of a MQTT Sparkplug B & Cloud Broker: No Software Installation or Maintenance Required
One of the fun parts of this demonstration is that no software will be installed. HiveMQ Cloud, Opto 22 grov Rio, and Canary Cloud platforms support MQTT Sparkplug B specification. So, if your plant-floor device or PLC supports MQTT Sparkplug B, transferring your plant process data to the Canary Historian is just plug and play. To showcase this possibility, here’s a step-by-step guide on how to go about it.
Step-by-Step Guide to Connecting an Edge Device to MQTT Broker and Visualizing the IIoT Data
HiveMQ Cloud acts as a reliable cloud-based MQTT message broker. It securely receives MQTT messages, which are being published from the plant-floor and forwards them to the Canary Cloud platform, quickly and efficiently. To receive MQTT messages from the MQTT broker, Canary Cloud uses MQTT Collector.
Follow the below steps to set up everything.
Step 1: Setting up HiveMQ Cloud MQTT Broker
To setup your MQTT broker on HiveMQ Cloud, follow the below steps:
Visit HiveMQ MQTT Cloud broker page and sign up for the free version.
Once you sign up, either use your email ID or your GitHub login to log in to your account.
Set up your cluster as soon as you log in for the first time.
Note: While setting up your cluster, you need to set up credentials that your device and Canary MQTT connector will use to connect to the MQTT broker. Refer to the below image. Note that, you can change your credentials as and when required.
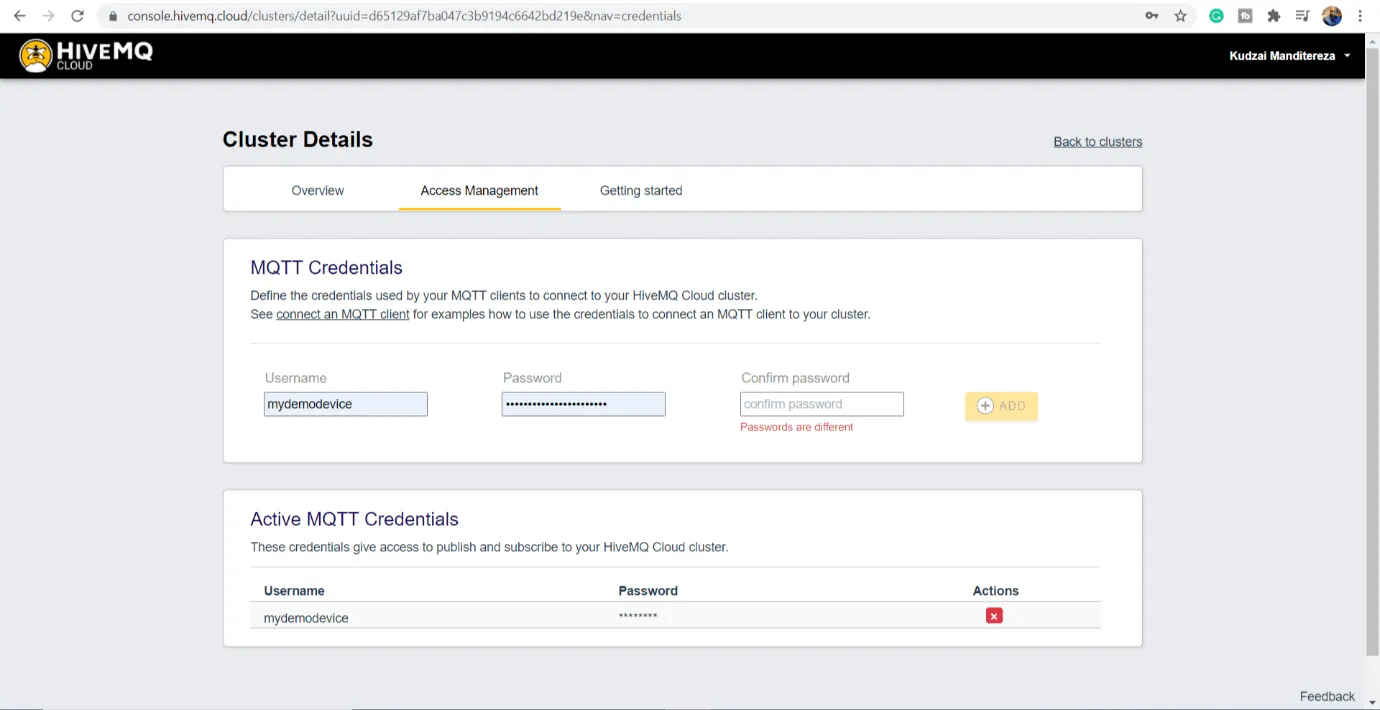
4. Once you are logged into the HiveMQ Cloud console, you can see the clusters available for your account and their statuses. For each cluster, you can see your broker’s url address or hostname and the port number.
5. Click on Manage Cluster.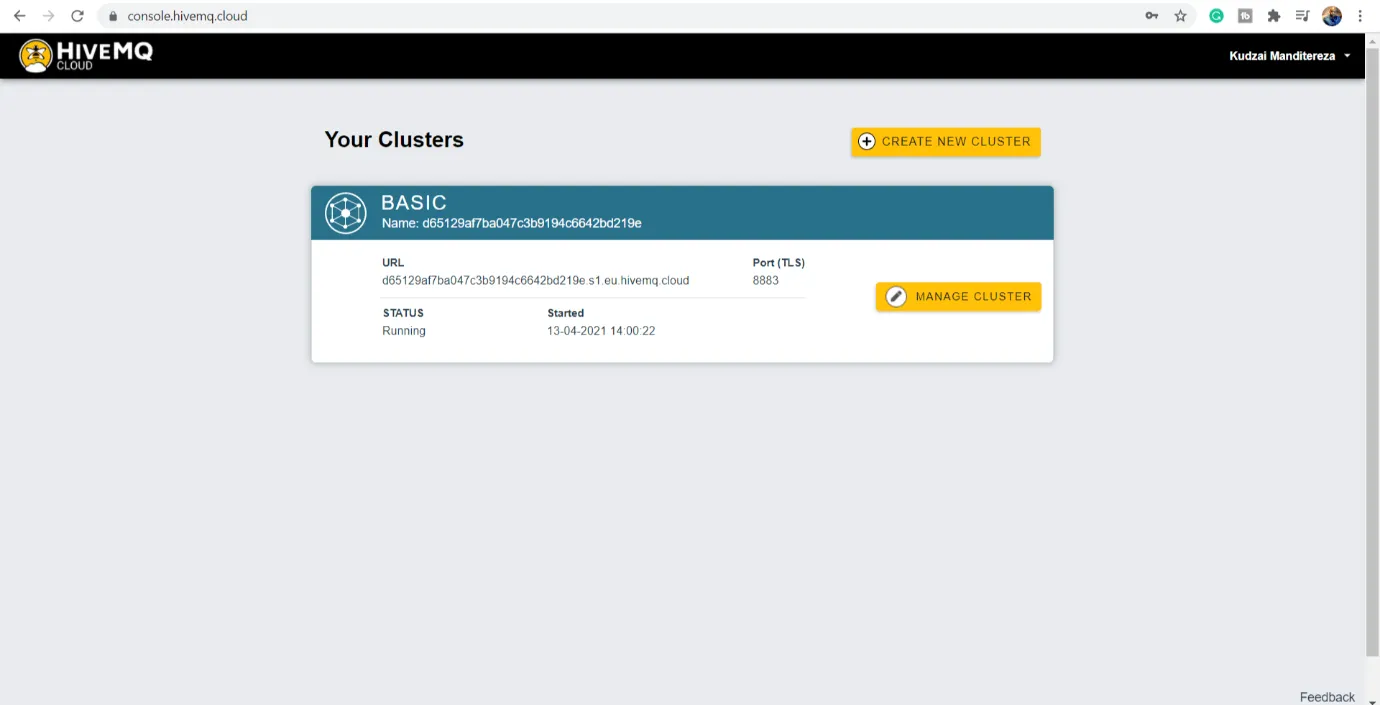
6. Get more details about your cluster, as shown below. You can also edit access credentials here.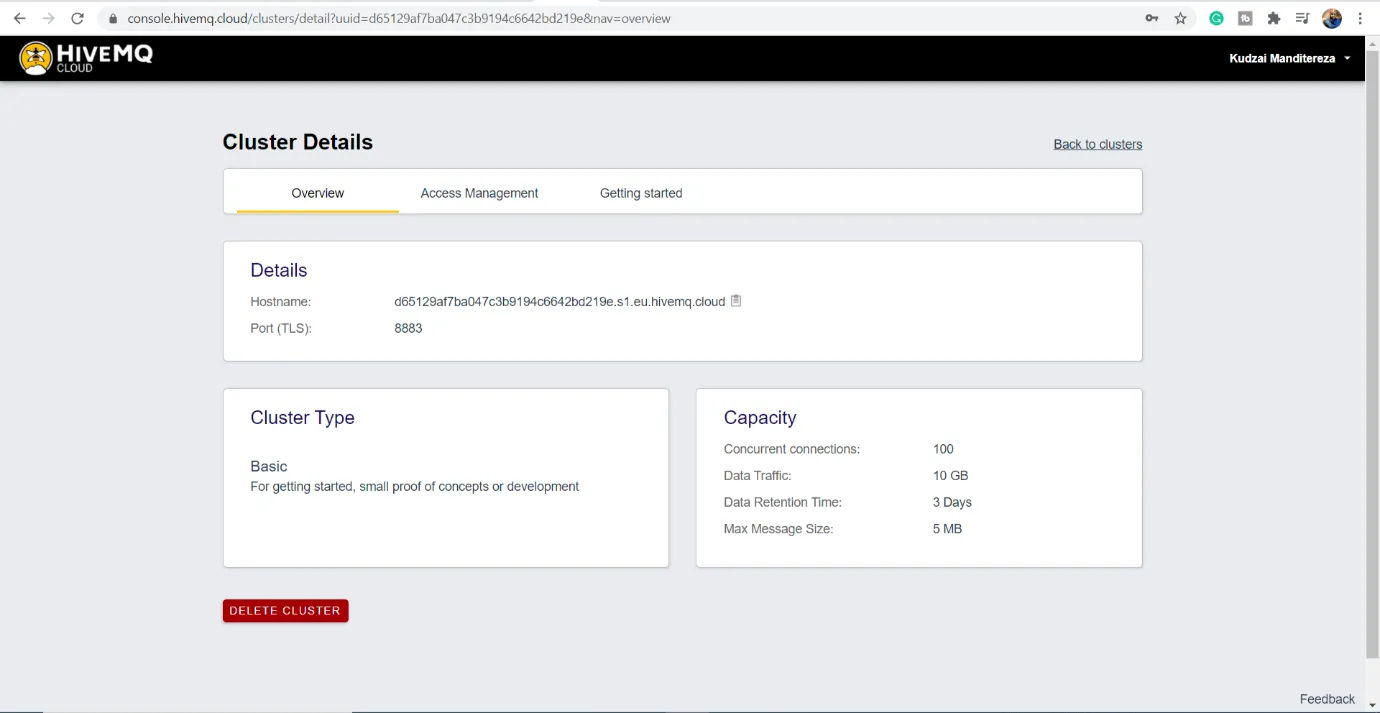
7. Once you set up your cluster, an MQTT Broker is automatically provisioned to you.
Step 2: Configuring Opto 22 groov Rio IO Hardware Device
Follow the below steps to configure your Opto 22 groov Rio, so that it starts publishing the liquid level, the temperature level, and the pressure level values of your Cooling Tower as MQTT Sparkplug B messages to your HiveMQ Cloud MQTT broker.
Refer to the hardware setup as shown in Image 1.
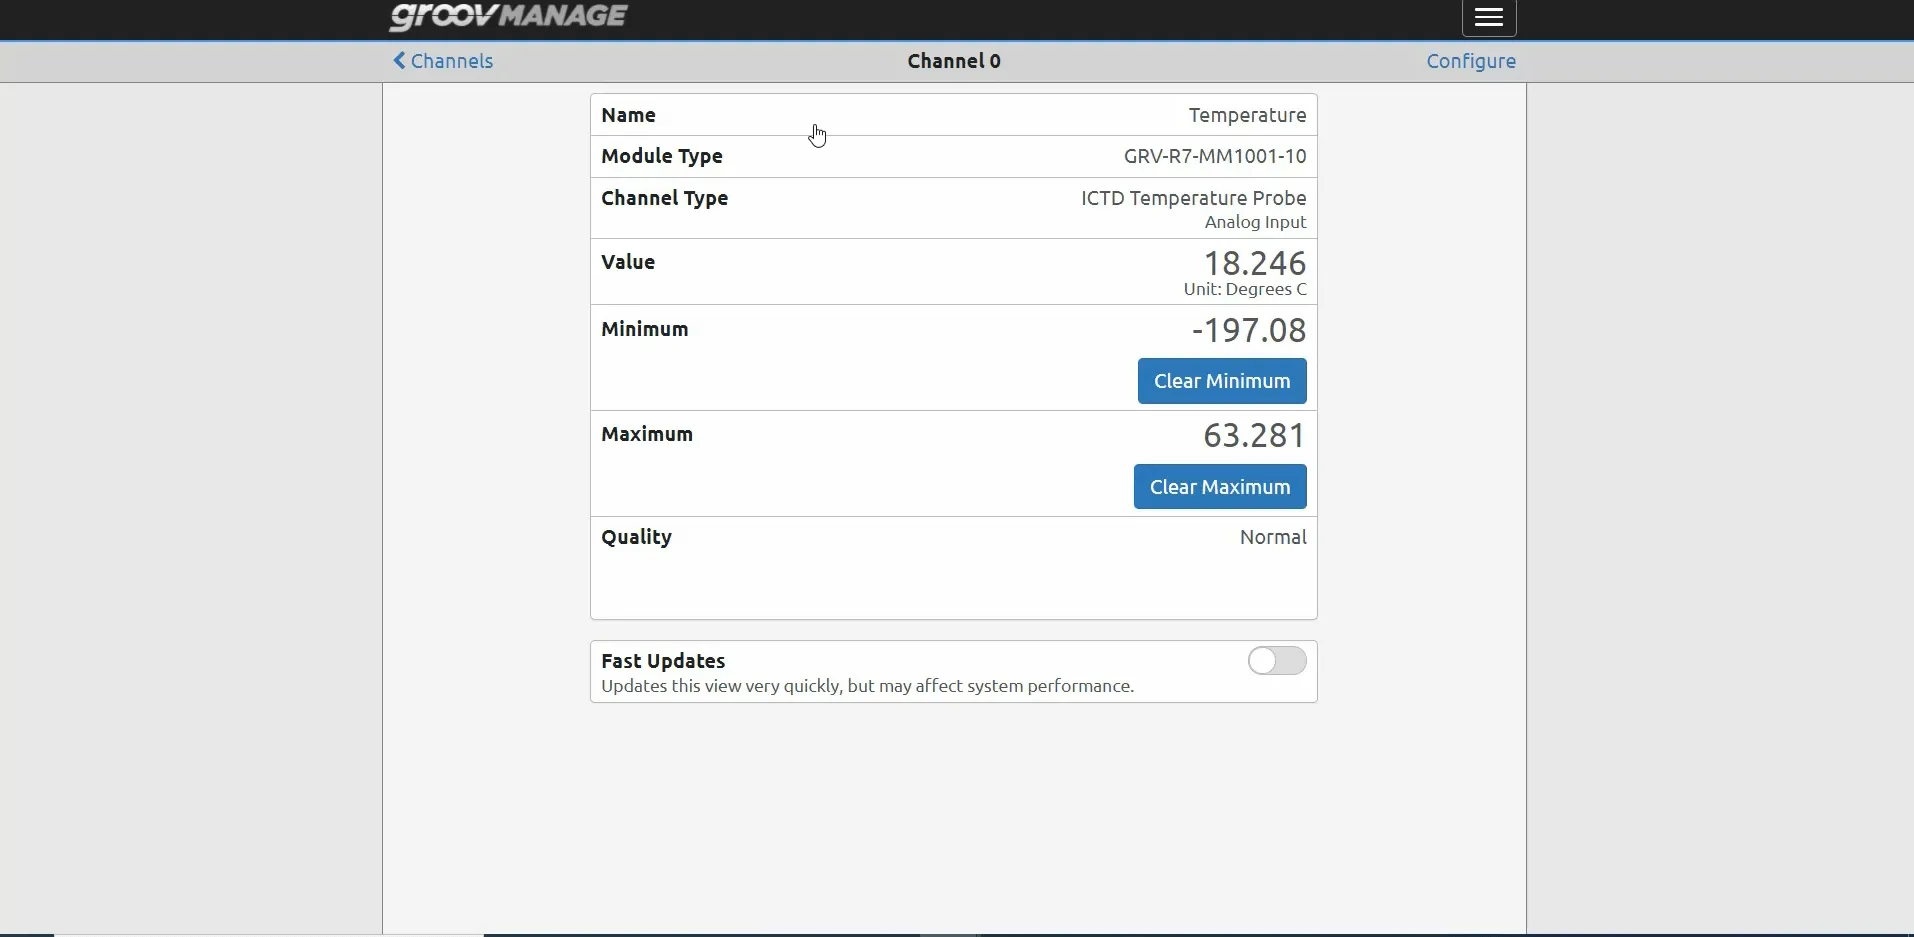
Connect an ICTD temperature probe to channel 0 of your Groov Rio IO, for temperature measurement.
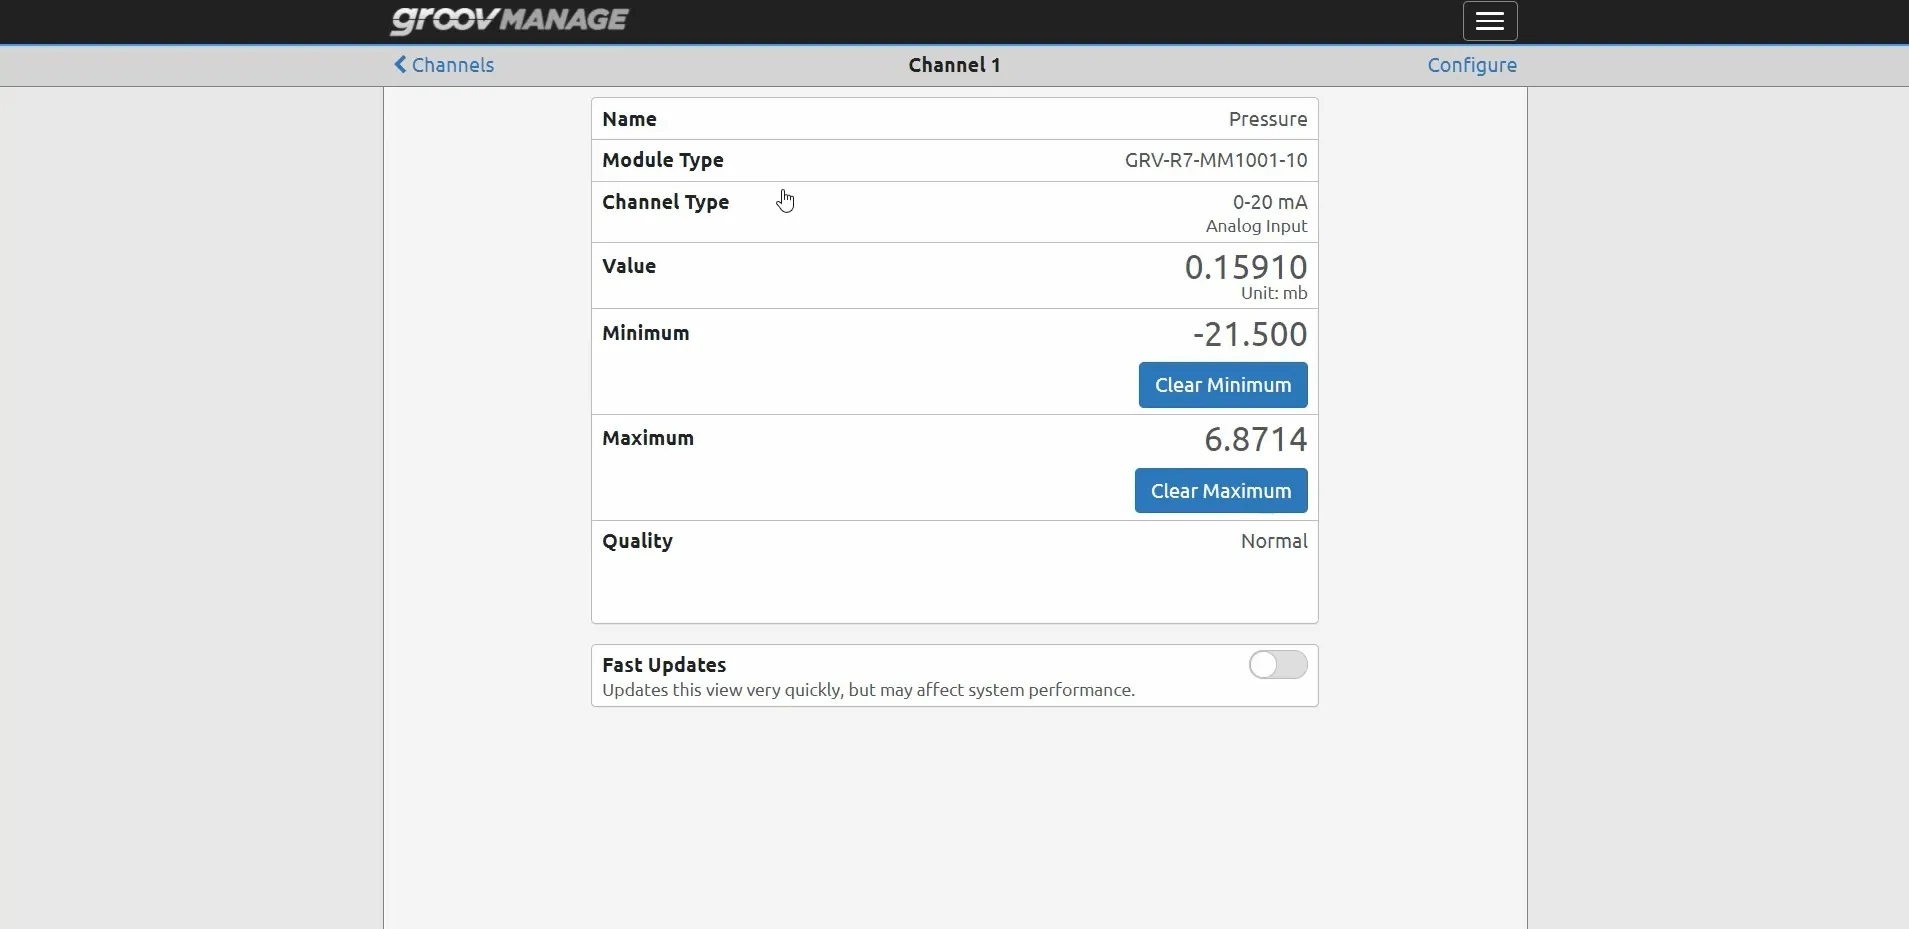
Connect a 4-20mA pressure transducer to channel 1 of your Groov Rio IO, for pressure measurement.
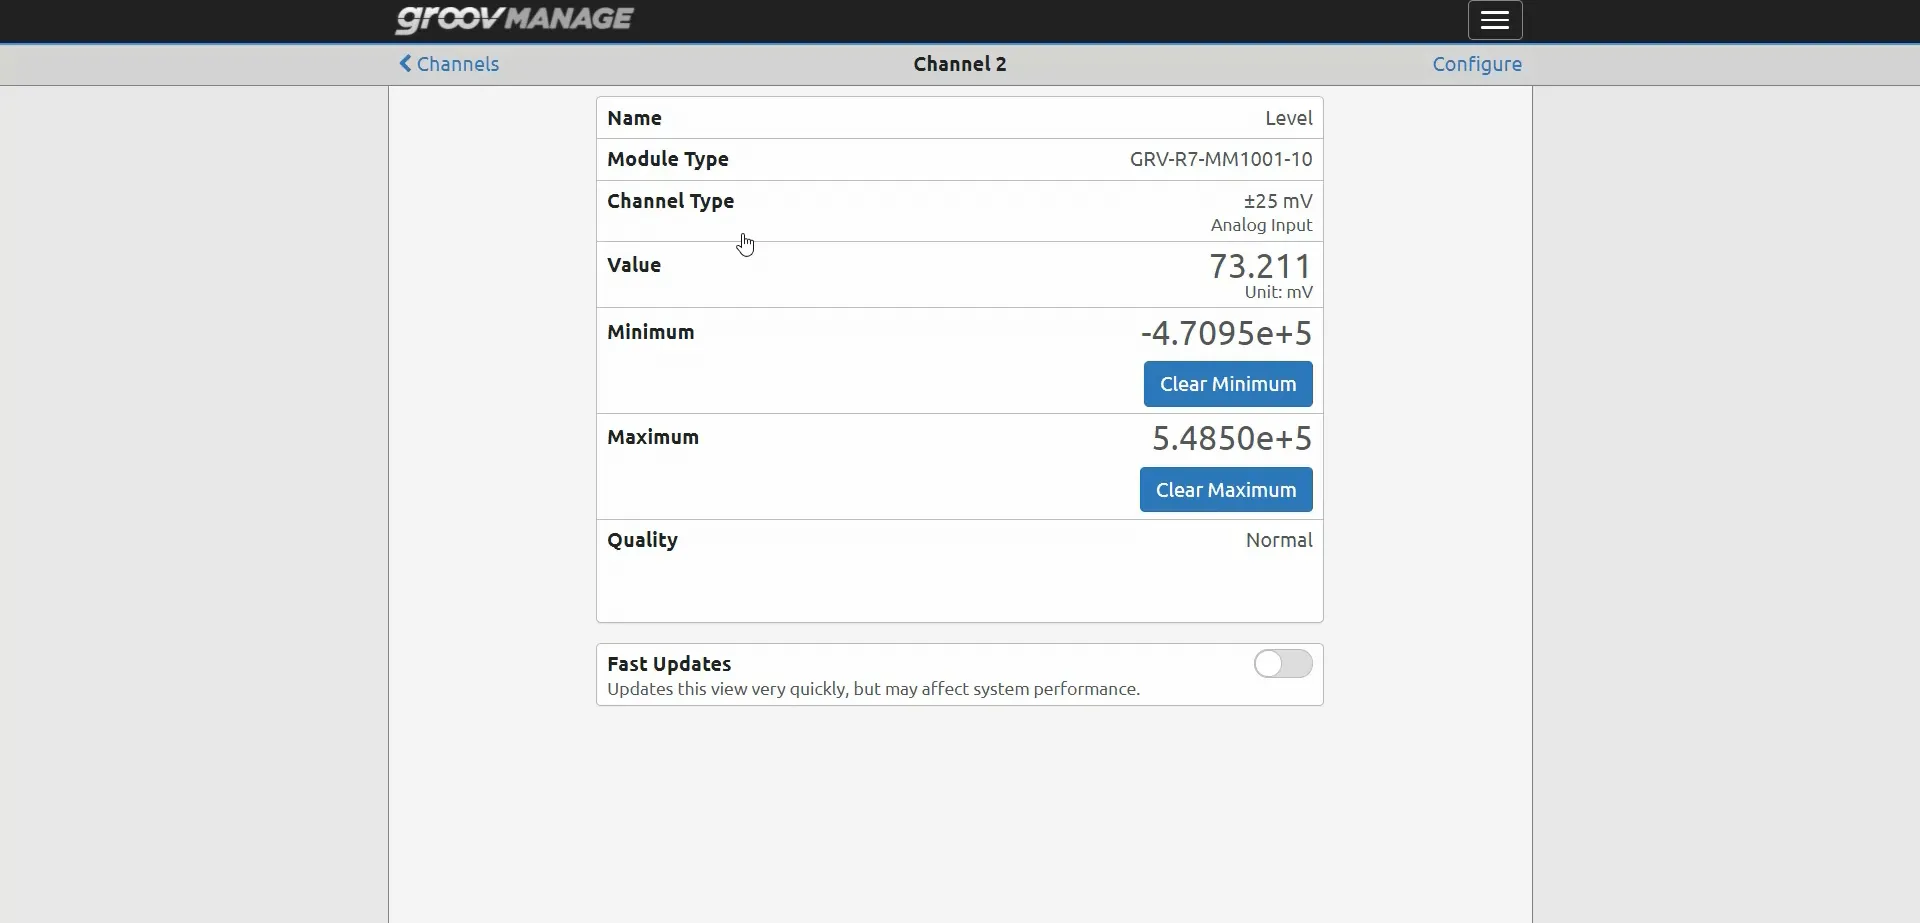
Connect a Loadcell’s output millivolt signal to your Groov Rio as an analog input on channel 2 and place a liquid container on top of the Loadcell. This will help in measuring the rise and fall of the liquid level. You can measure it as 0% when the jar is empty and 100% when it is full.
Go back to your browser and start configuring this device to publish these field measurements to the HiveMQ Cloud broker.
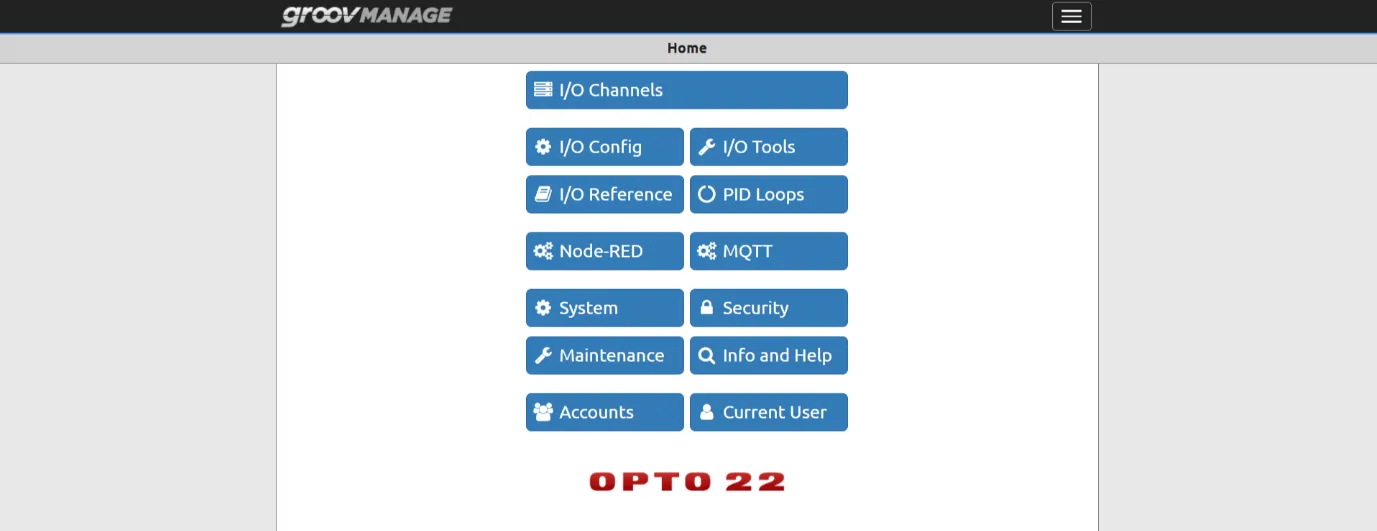
Log in to your Opto 22 groov Rio management interface on this IP address.
Select the IO channels as required. For example, select channel 0 to check the temperature, channel 1 to check the pressure, etc.
To check the temperature, select channel 0 and watch the temperature reading. In the below image the temperature currently reads 18.2 When you warm the liquid, the temperature readings will start to rise as shown in the image below.
To check the pressure level, select channel 1 and watch the pressure level reading. When you blow the transducer, the temperature readings will start to rise as shown in the image below.
To check the liquid level in the container, select channel 2 and note the liquid level reading. When you pour some more liquid to the container, the liquid level will start to rise as shown in the image below.
Step 3: Setting up MQTT and Sparkplug B for Publishing
To get the temperature, pressure, and liquid level readings or data to the Canary platform, it is essential that you configure your Opto22 groov Rio to publish cooling tower information to your HiveMQ Cloud broker. To enable MQTT Sparkplug B to start publishing, follow the below configuration steps:
Go to MQTT configuration page in Opto 22 groov Manage and click on Configuration. The Configuration page will open as shown in the image below.
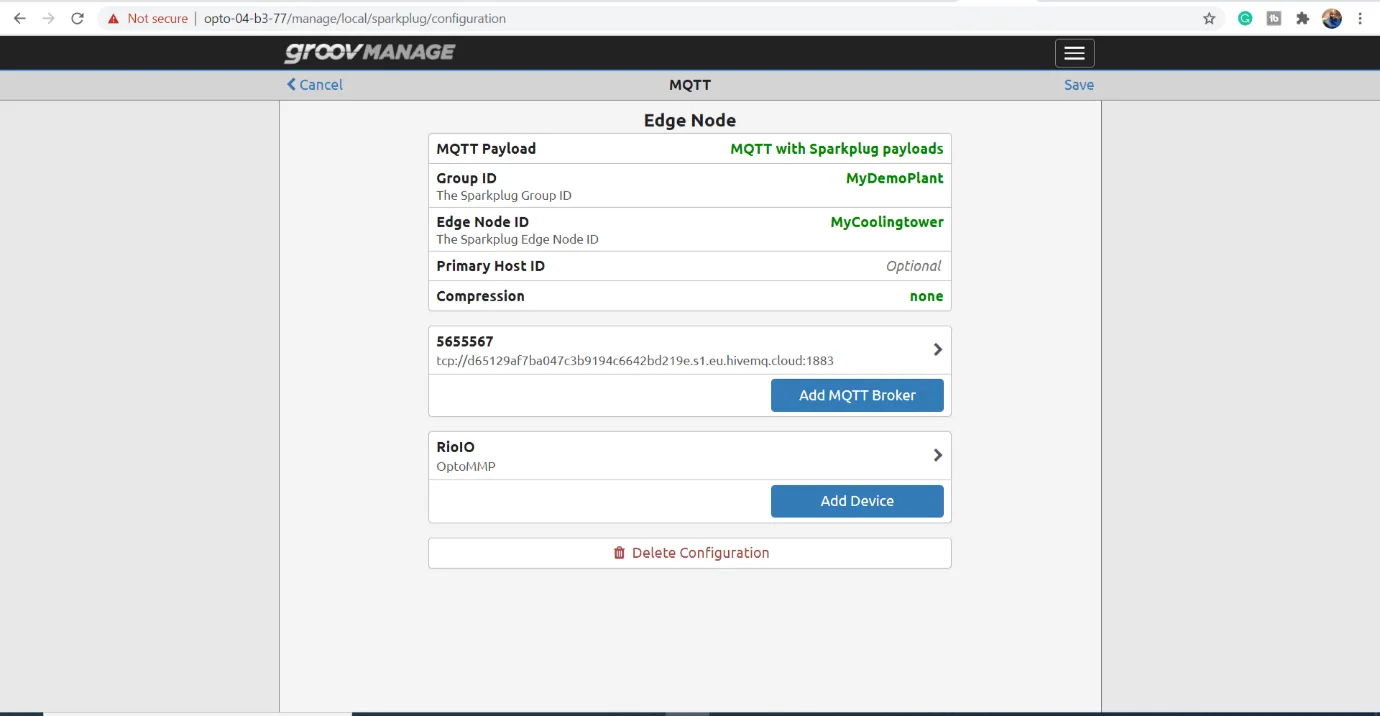
In the Configuration page, you can choose to either send MQTT messages as Sparkplug payloads or as string payloads. We chose to send the MQTT messages as Sparkplug payloads.
Specify your Sparkplug Group ID and Edge Node ID. For the purpose of this demo, we have specified Sparkplug Group ID as MyDemoPlant and the Edge Node ID as MyCoolingTower.
Click on Add MQTT Broker as shown in the image below.
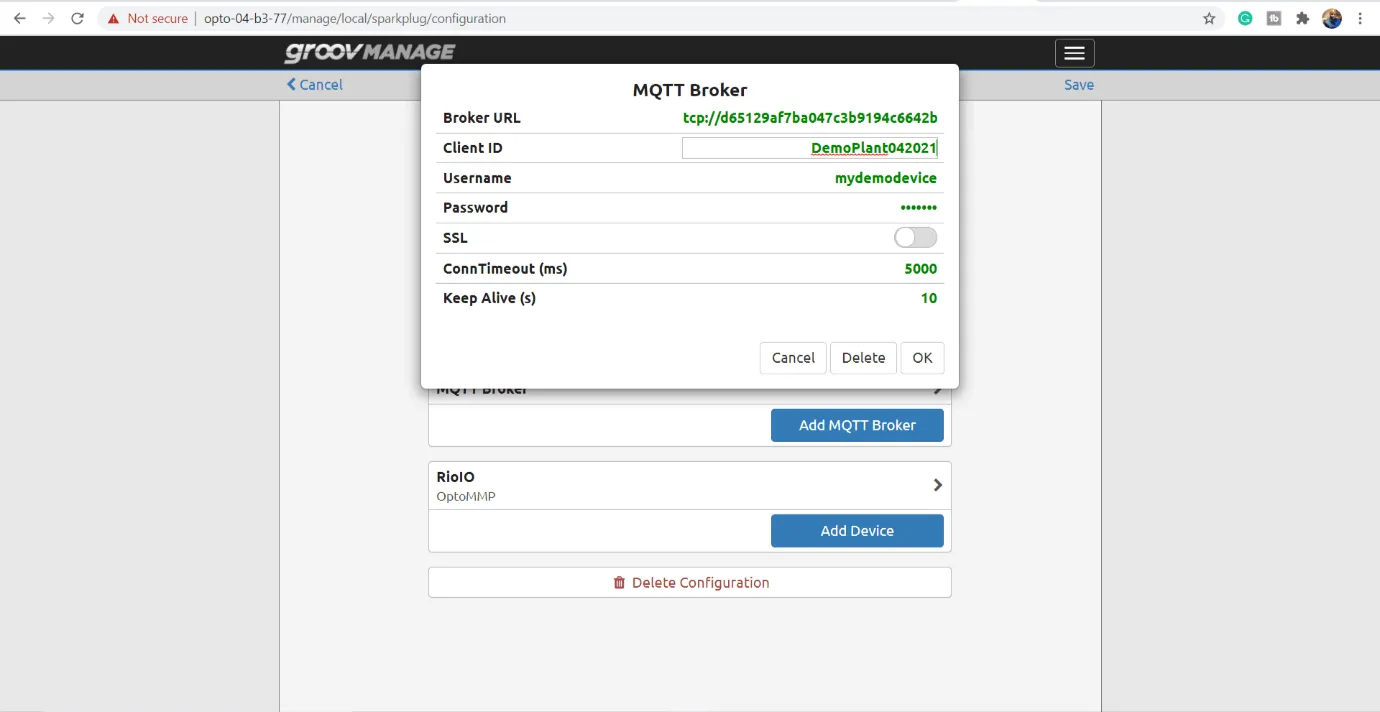
Add all the HiveMQ Cloud broker details, such as the Broker URL or hostname, which you copied earlier.
Provide the client a unique and descriptive name.
Enter the username and password details, which you configured on your HiveMQ cluster.
Enable SSL for secure communication.
Specify your Sparkplug Device ID as RioIO.
Step 4: Configuring Canary Historian to Receive MQTT Sparkplug B Messages
To start receiving the messages from MQTT to Canary Cloud, you need to first configure Canary Collector. Follow the below steps:
Configure the MQTT Collector on the Canary platform. To configure the MQTT collector, you need to run the Canary Administrator application. Our Canary system here is already licensed and installed properly. From the table below, you can see that no collectors are enabled or configured yet.
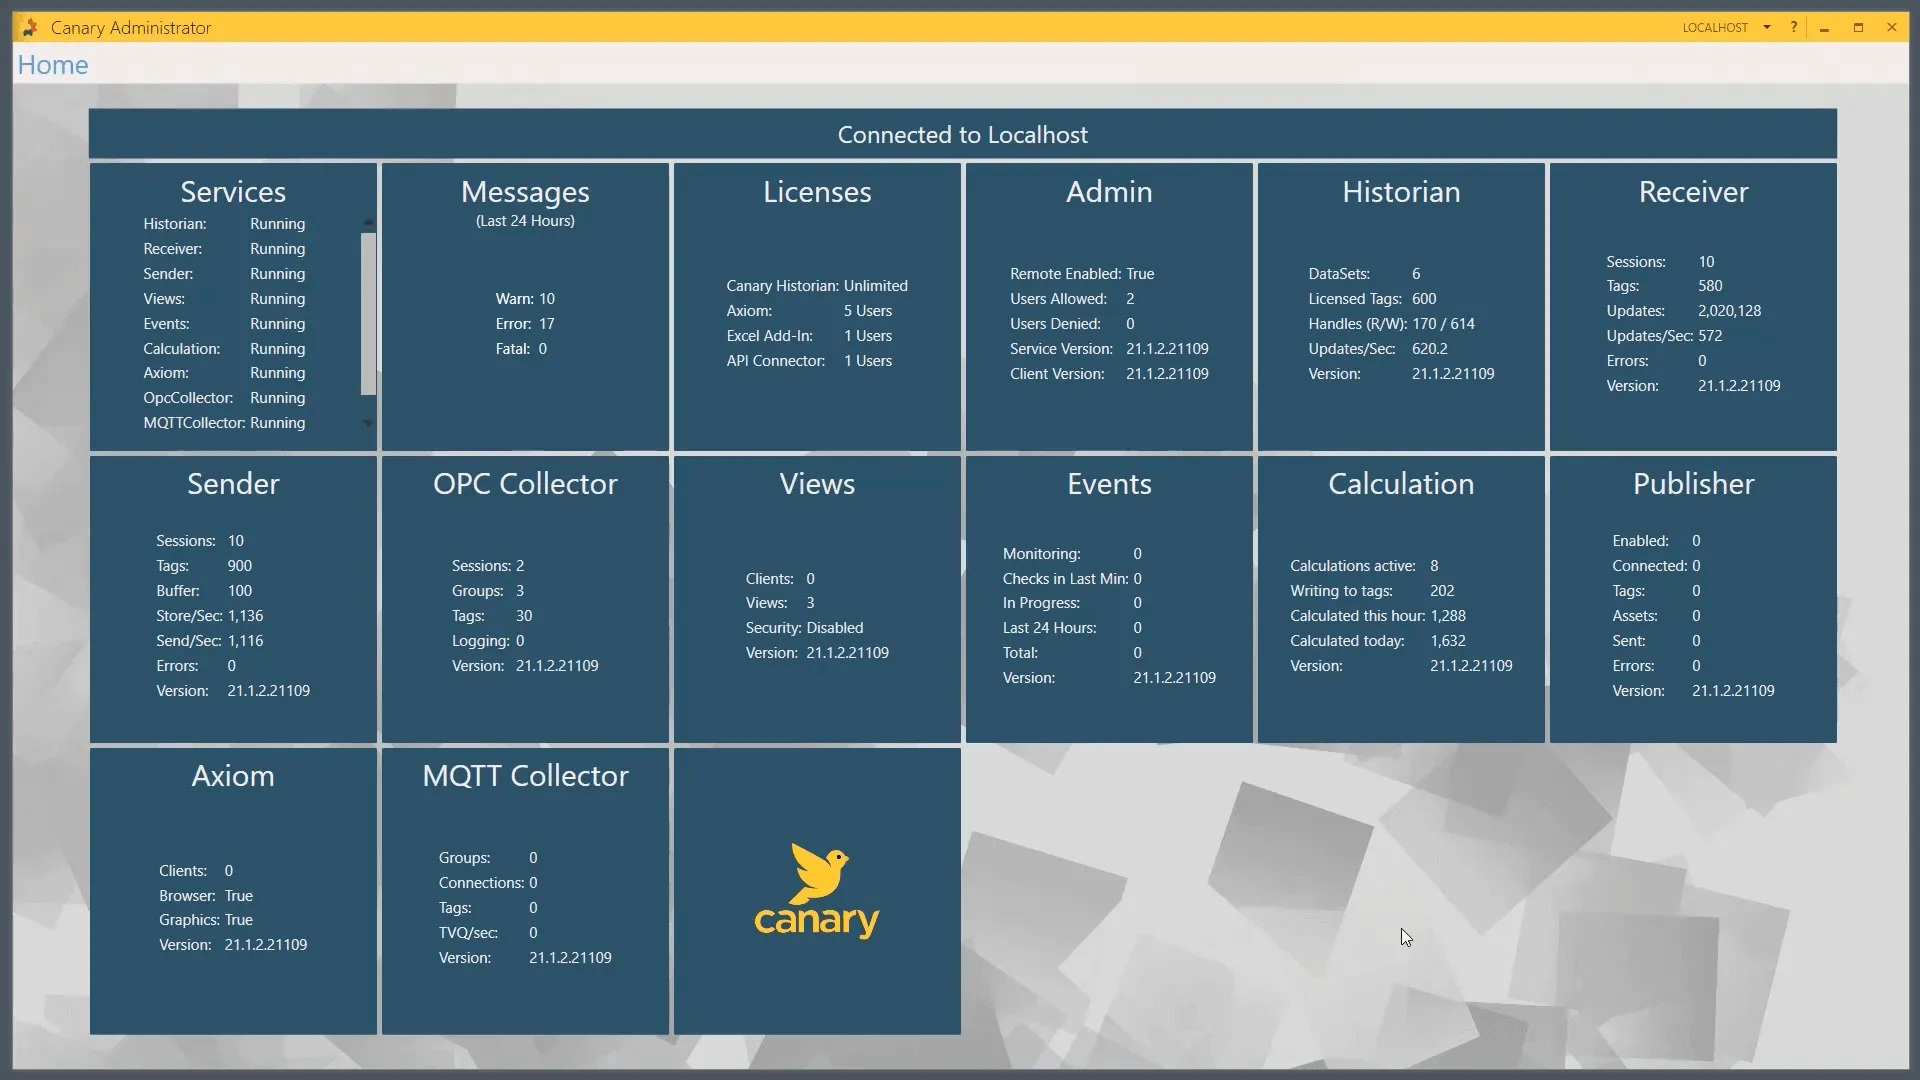
Click on the Configuration tab to establish a new Connection Group. A new window will open as shown below. All the components of that Connection Group are automatically populated in the window for you to configure.
Fill in the details to customize your new Connection Group according to your needs. For example, provide the Name, Client ID, etc. Here, we have used HiveMQDemo as our Connection Group name as shown below:
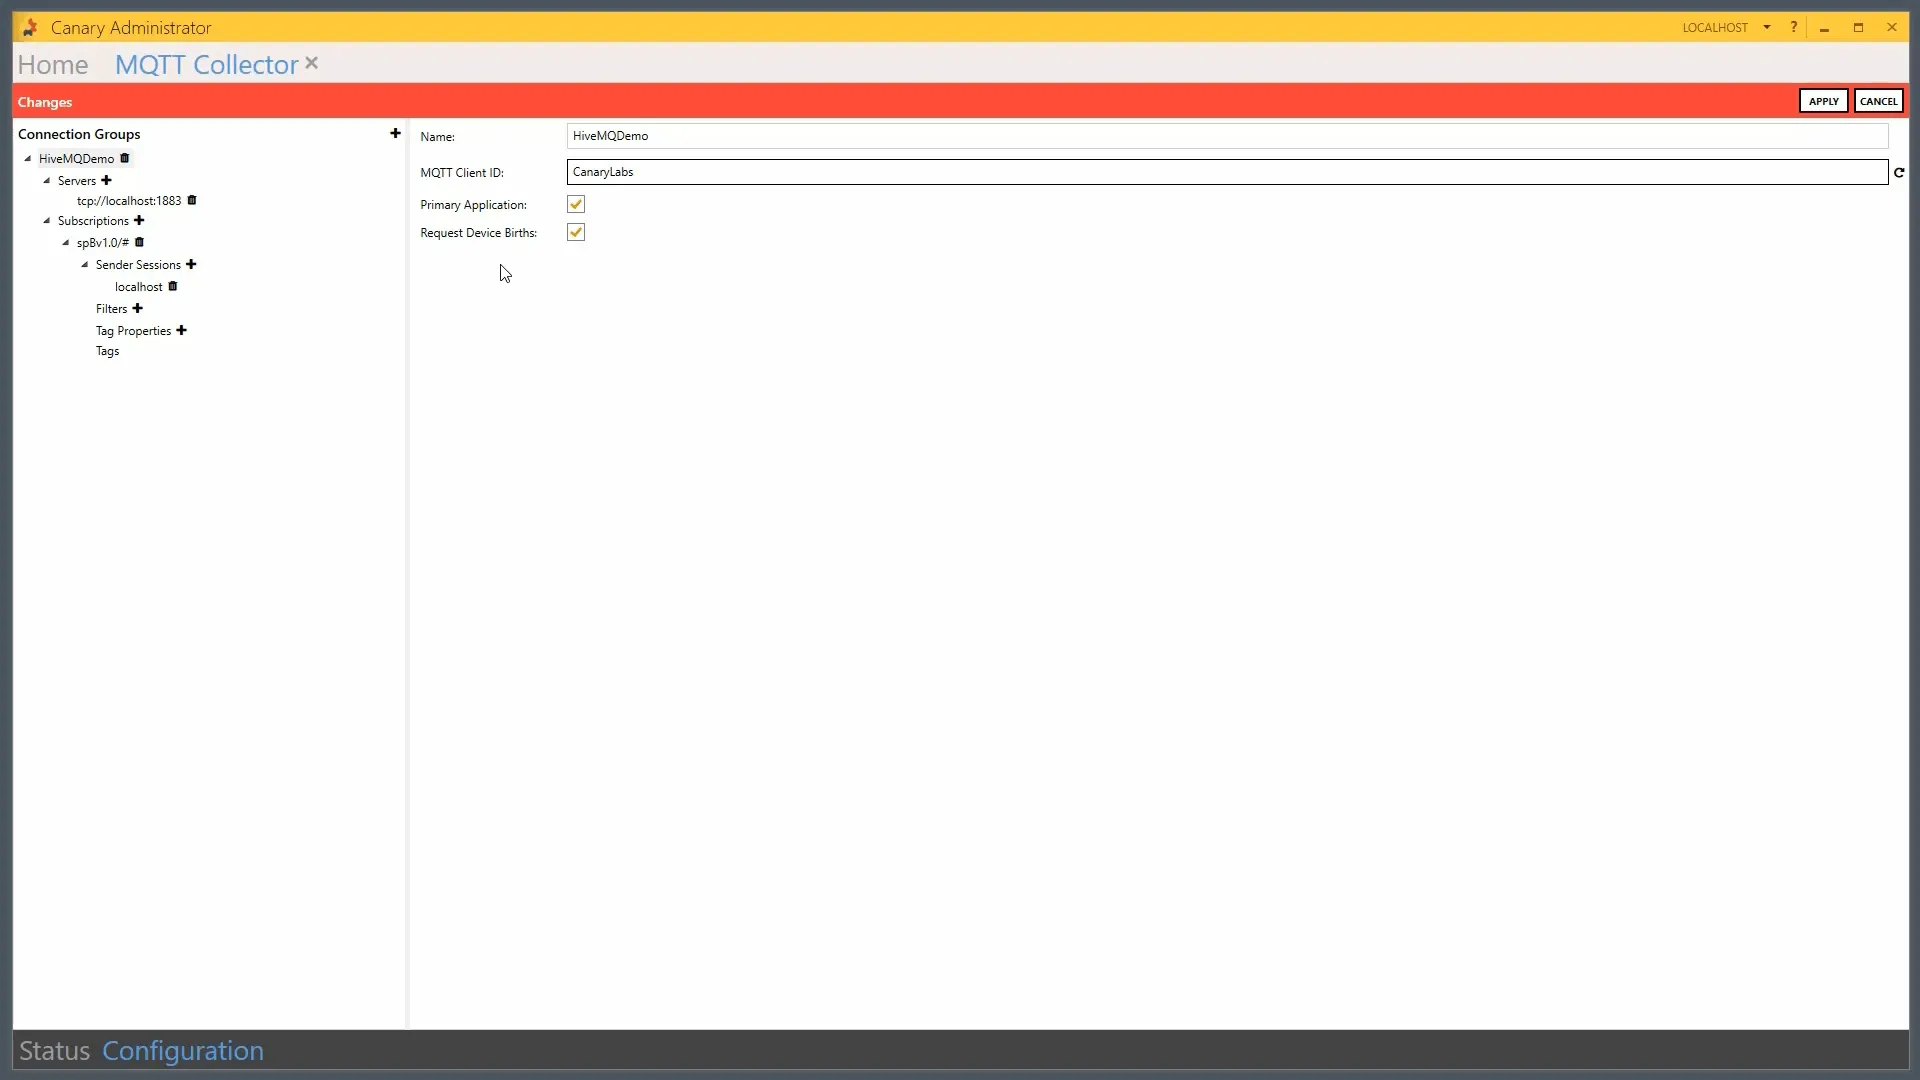
Click on the Servers drop down menu in the left hand window and build out the servers as shown in the image below:
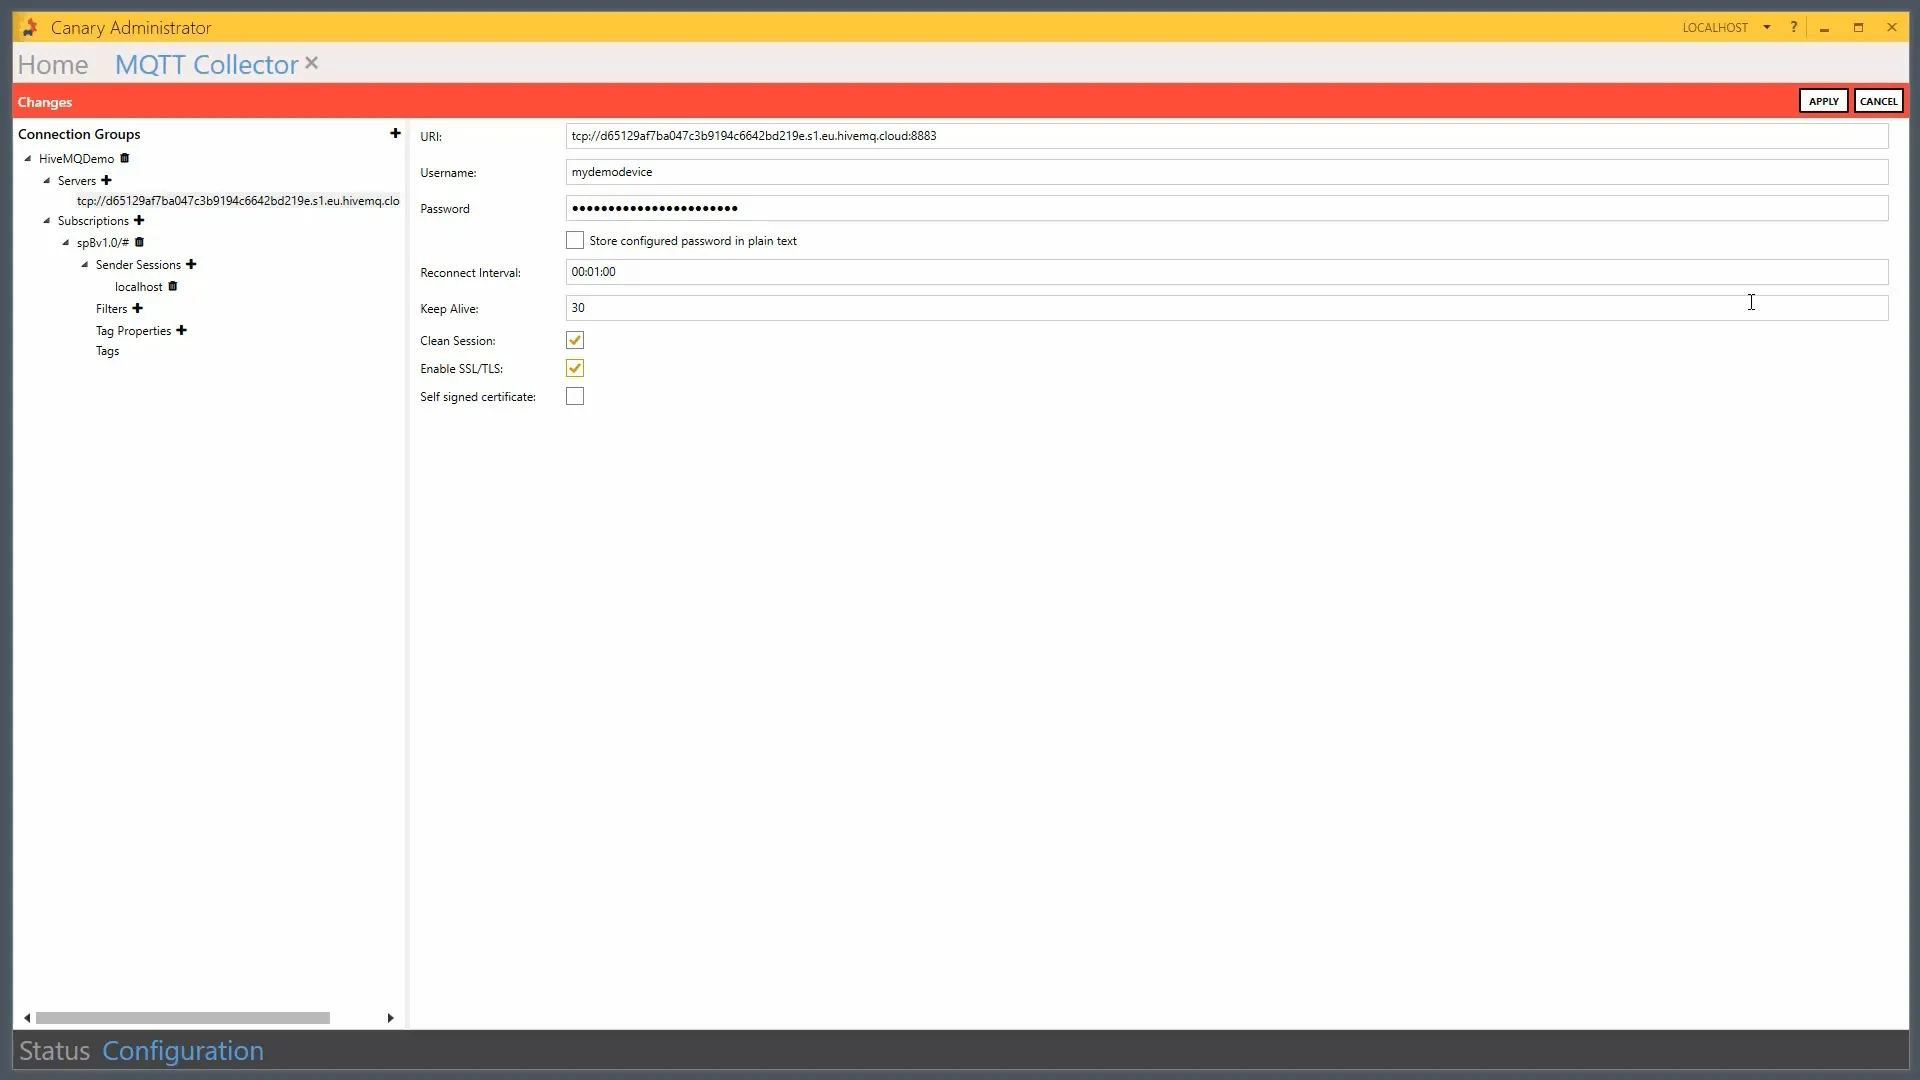
Copy and paste the unique information to HiveMQ Cloud.
Change the server configuration from public to secure
8883.Enter the username and password.
Enable SSL/TLS, because we are using
8883.Save the changes to configure your server.
Click on the Subscriptions drop down menu in the left hand window as shown below:
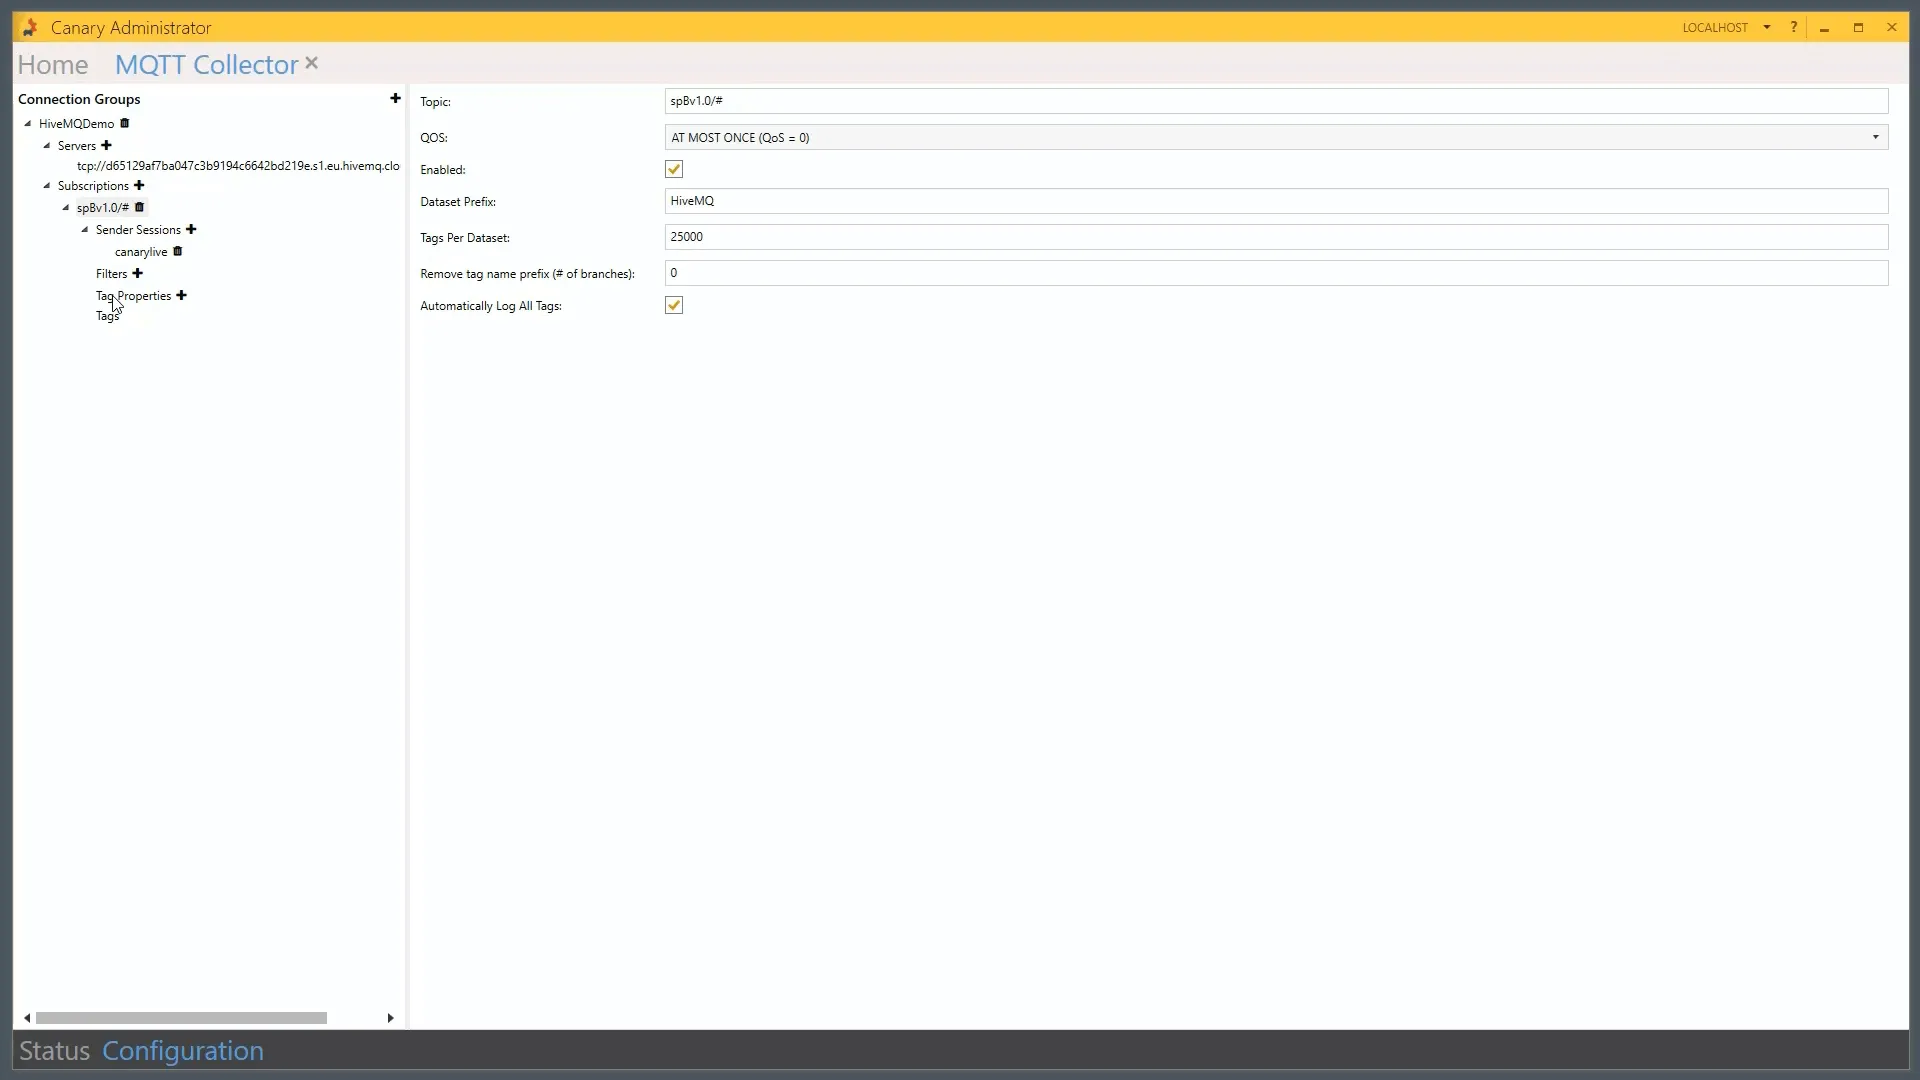
Modify the Subscription. We’ve already created a wildcard subscription by default. Likewise, you should subscribe and keep the wildcard ID and subscribe to everything that you have access to through the username.
We are going to automatically log all the tags that we find and name the data set that should be within Canary. We’ll call this the HiveMQ data set. Click Apply.
Tell the subscriber where the historian is located. By default, it’s looking for the local host. If you have the MQTT Collector installed locally to Canary Historian, you would leave a local host. In our instance here, we will be sending to a different historian, which would be our historian machine name called canarylive as shown below:
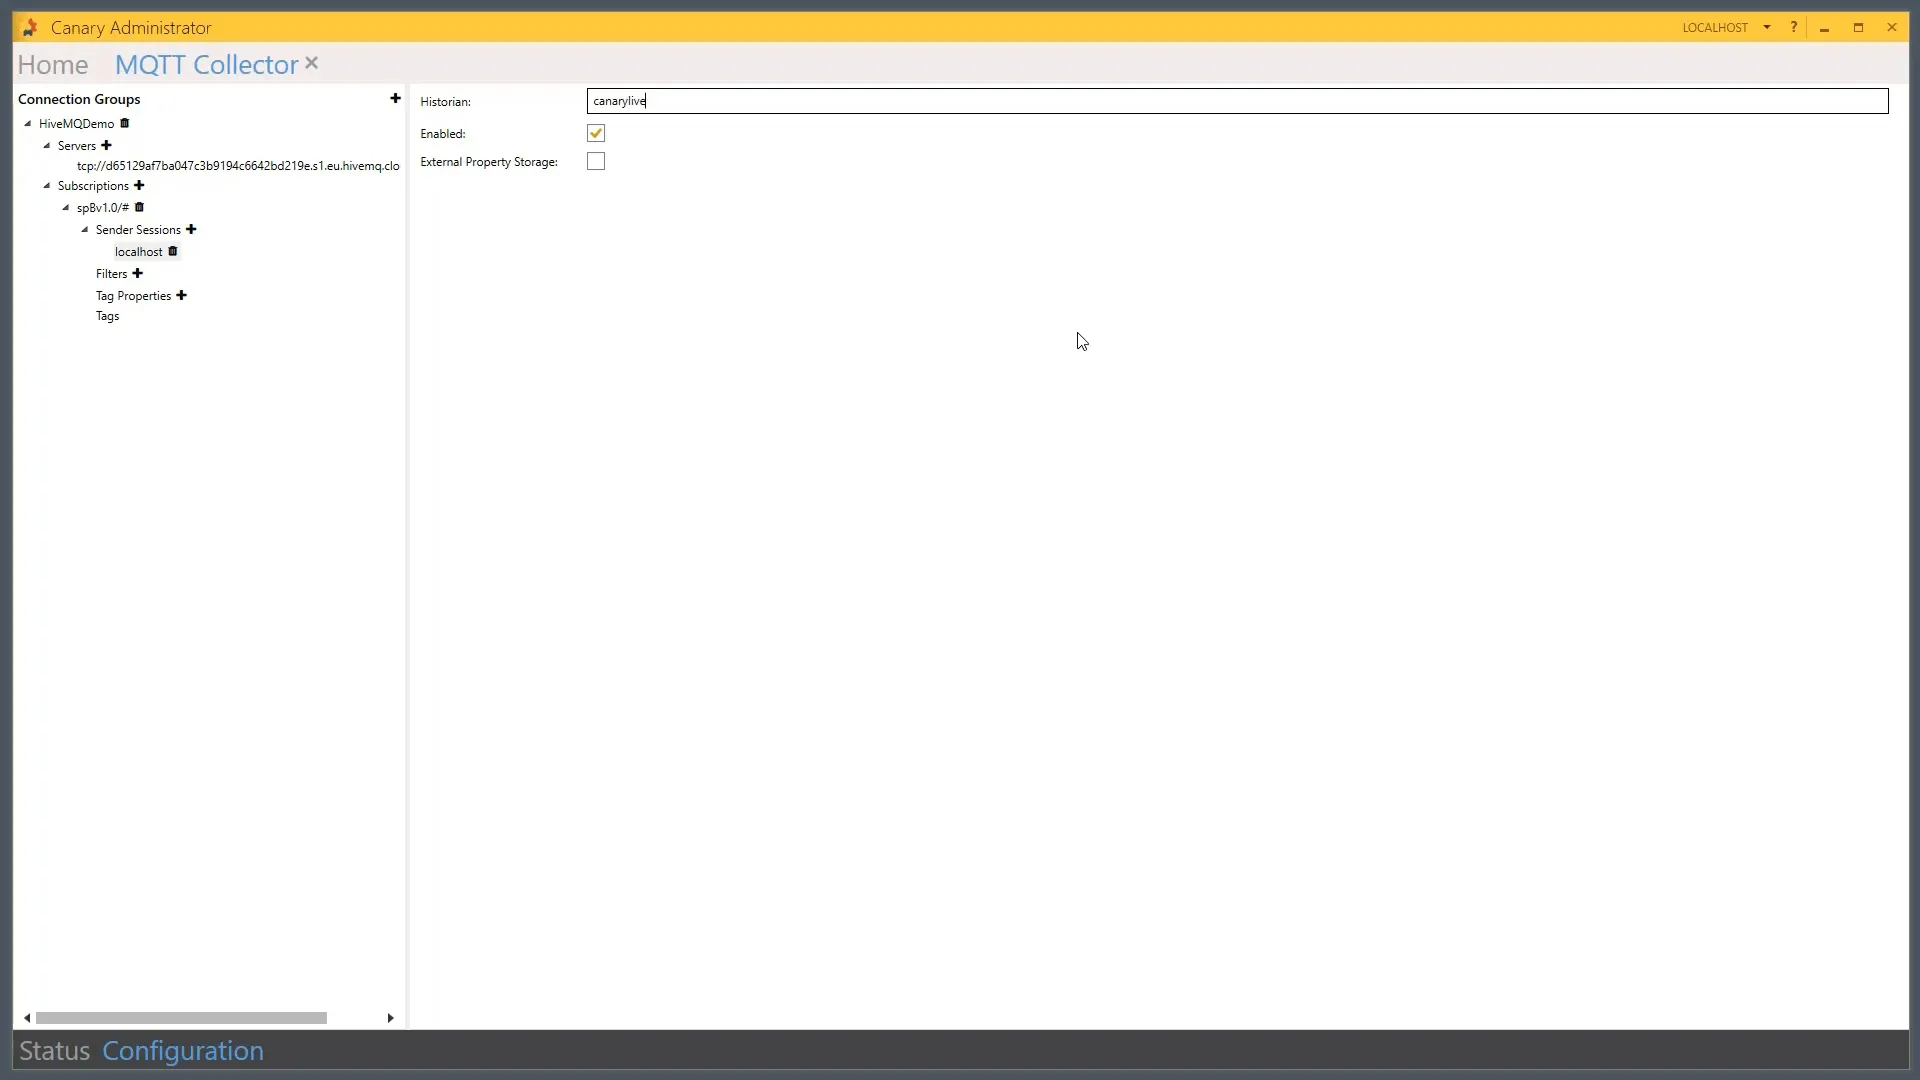
Note: You could also put in the IP address. However, we don’t need to do that. Based on our current configuration, we will apply those changes. If you want to create filters on the tags or perform additional optional configuration, use filters and tag properties
14. Check the Status on the left hand bottom corner. Now, you will be able to start the session. As shown in the image below, you are now connected, and the system is logging 20 tags. This data is currently coming to the historian.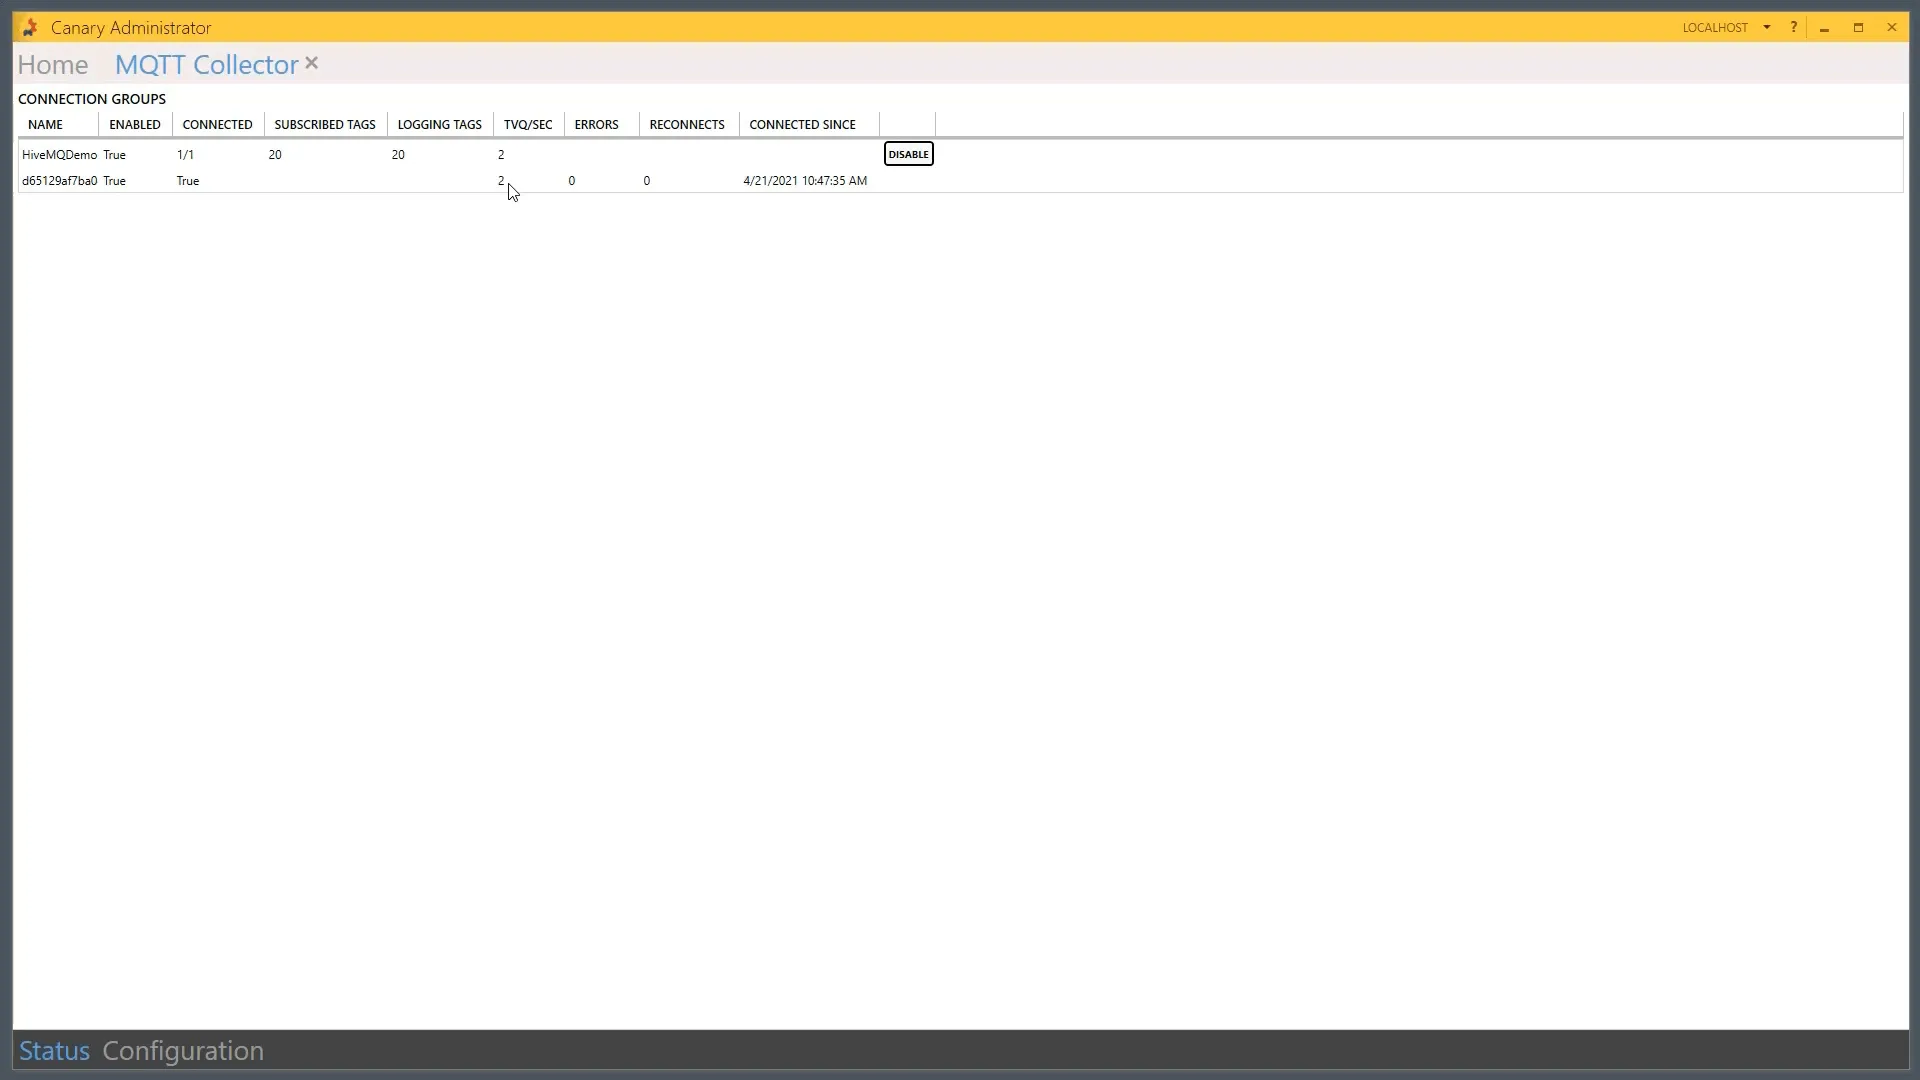
15. Go to Canary Historian in the Canary Administrator to find your data set. Here, you will find all the tags that you have been logging as shown below.
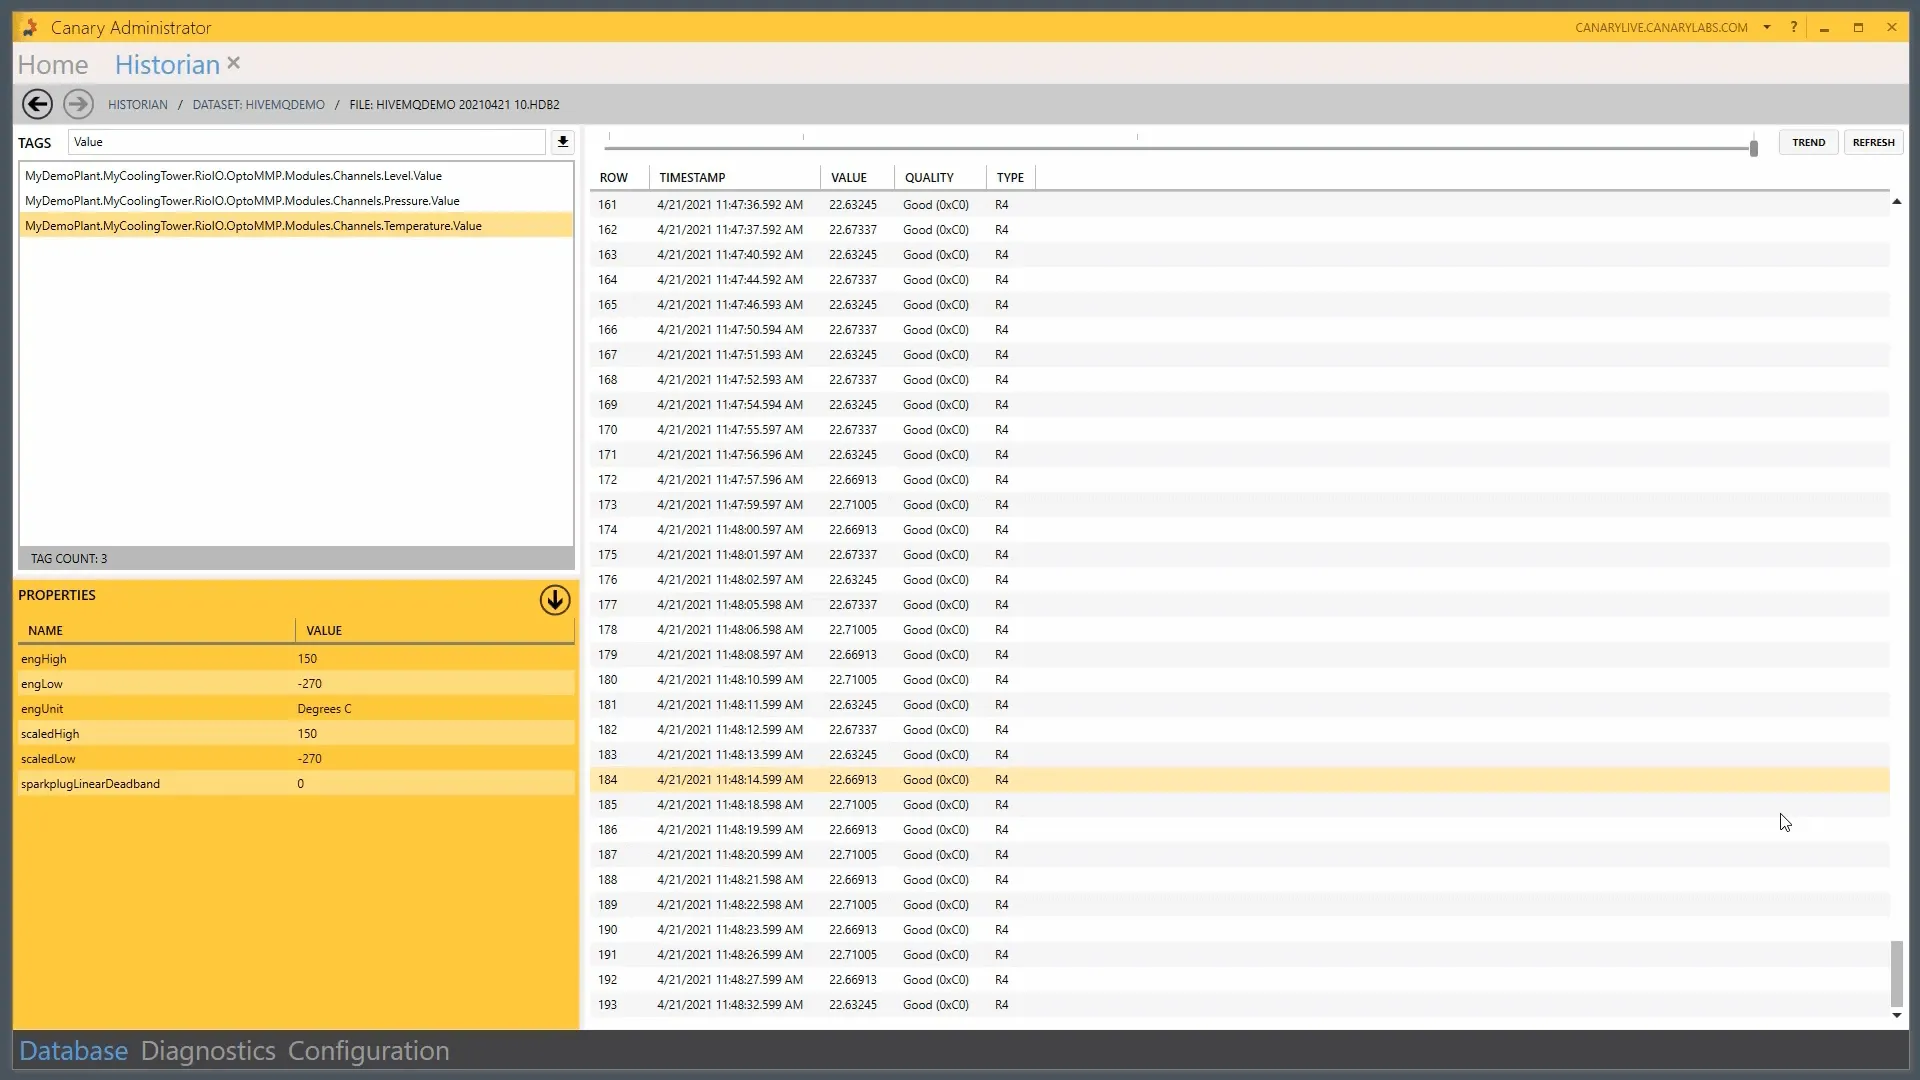 In the above image, you can find the liquid level, the pressure level, and the temperature tags.
You can also see this data by logging into Axiom and looking at your cloud instance.
Previously, we had created an application. In this application, we were able to see the level of pressure and temperature tags that we are logging from the broker.
Step 5: Visualizing Smart Factory Data on Canary Cloud
Once you have finished configuring Canary to get the data from MQTT, you can use Axiom to start visualizing your data.
Follow the below steps to create a dashboard for visualization:
Open your browser and type in the name of your server.
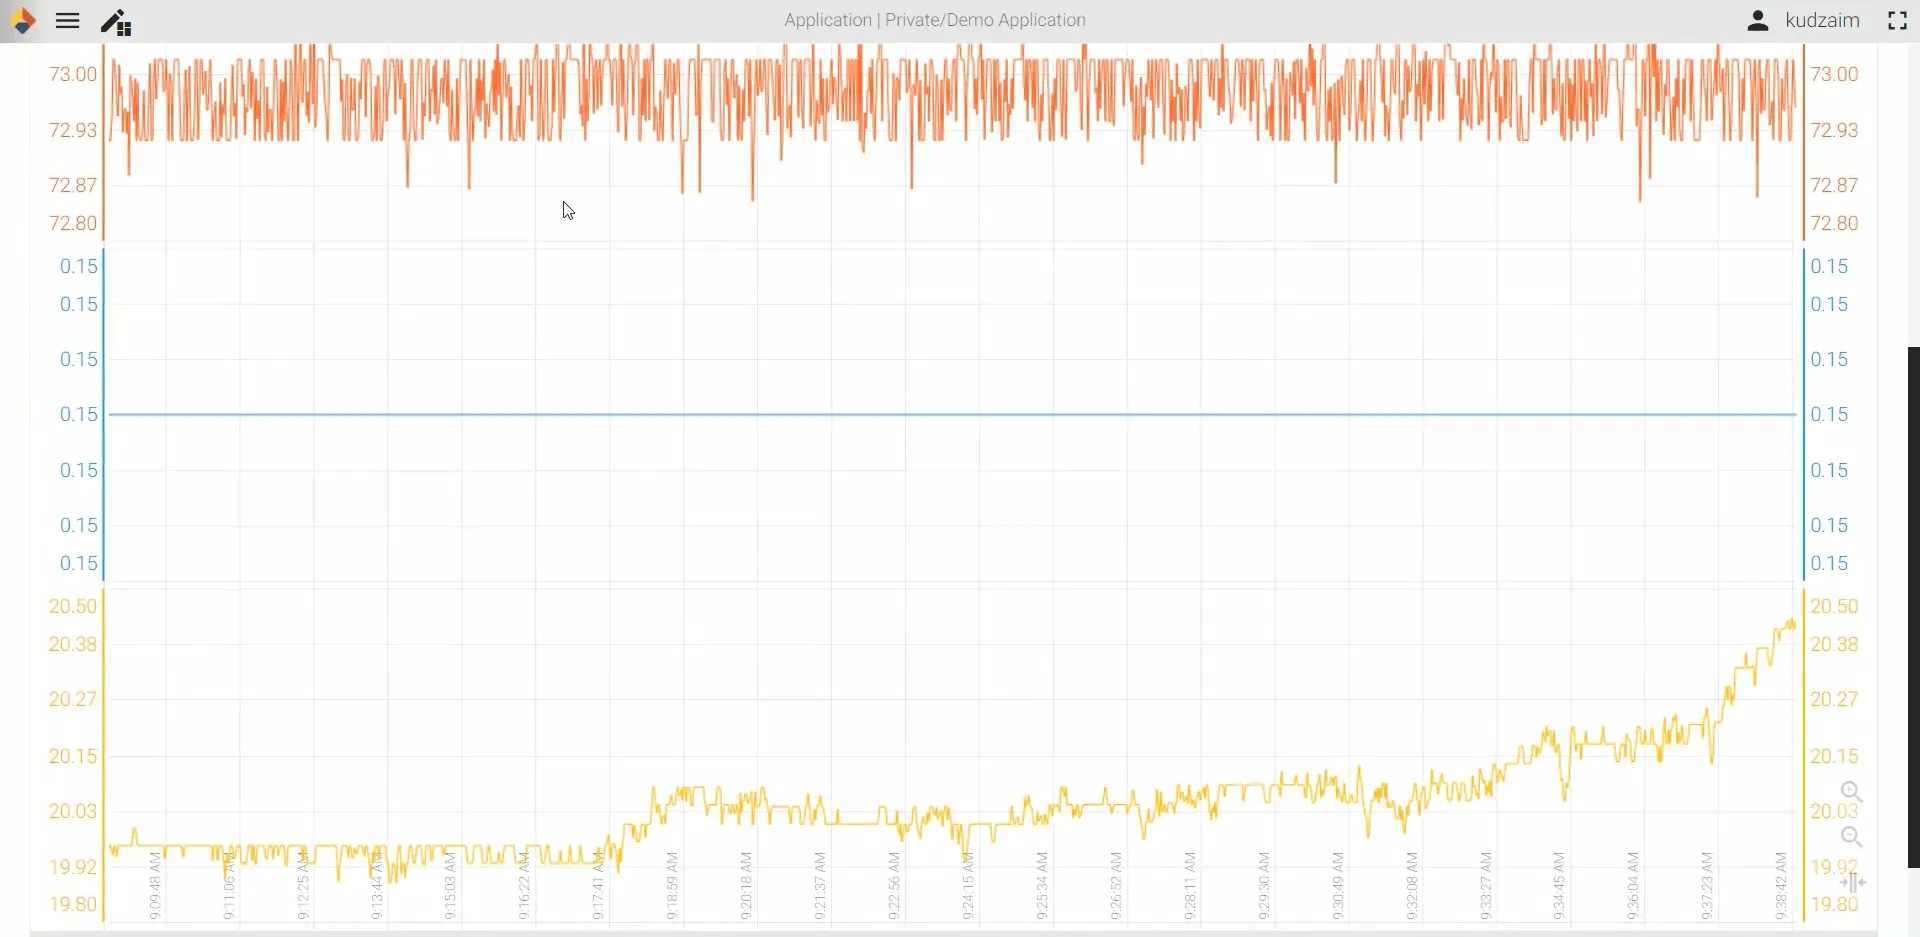
Build a trending chart for temperature, pressure and liquid level measurements on Axiom as shown below.

Click on Add Trends and expand your Cooling Tower Asset Model. Now, select the Levels, Temperature and Pressure, as shown below.
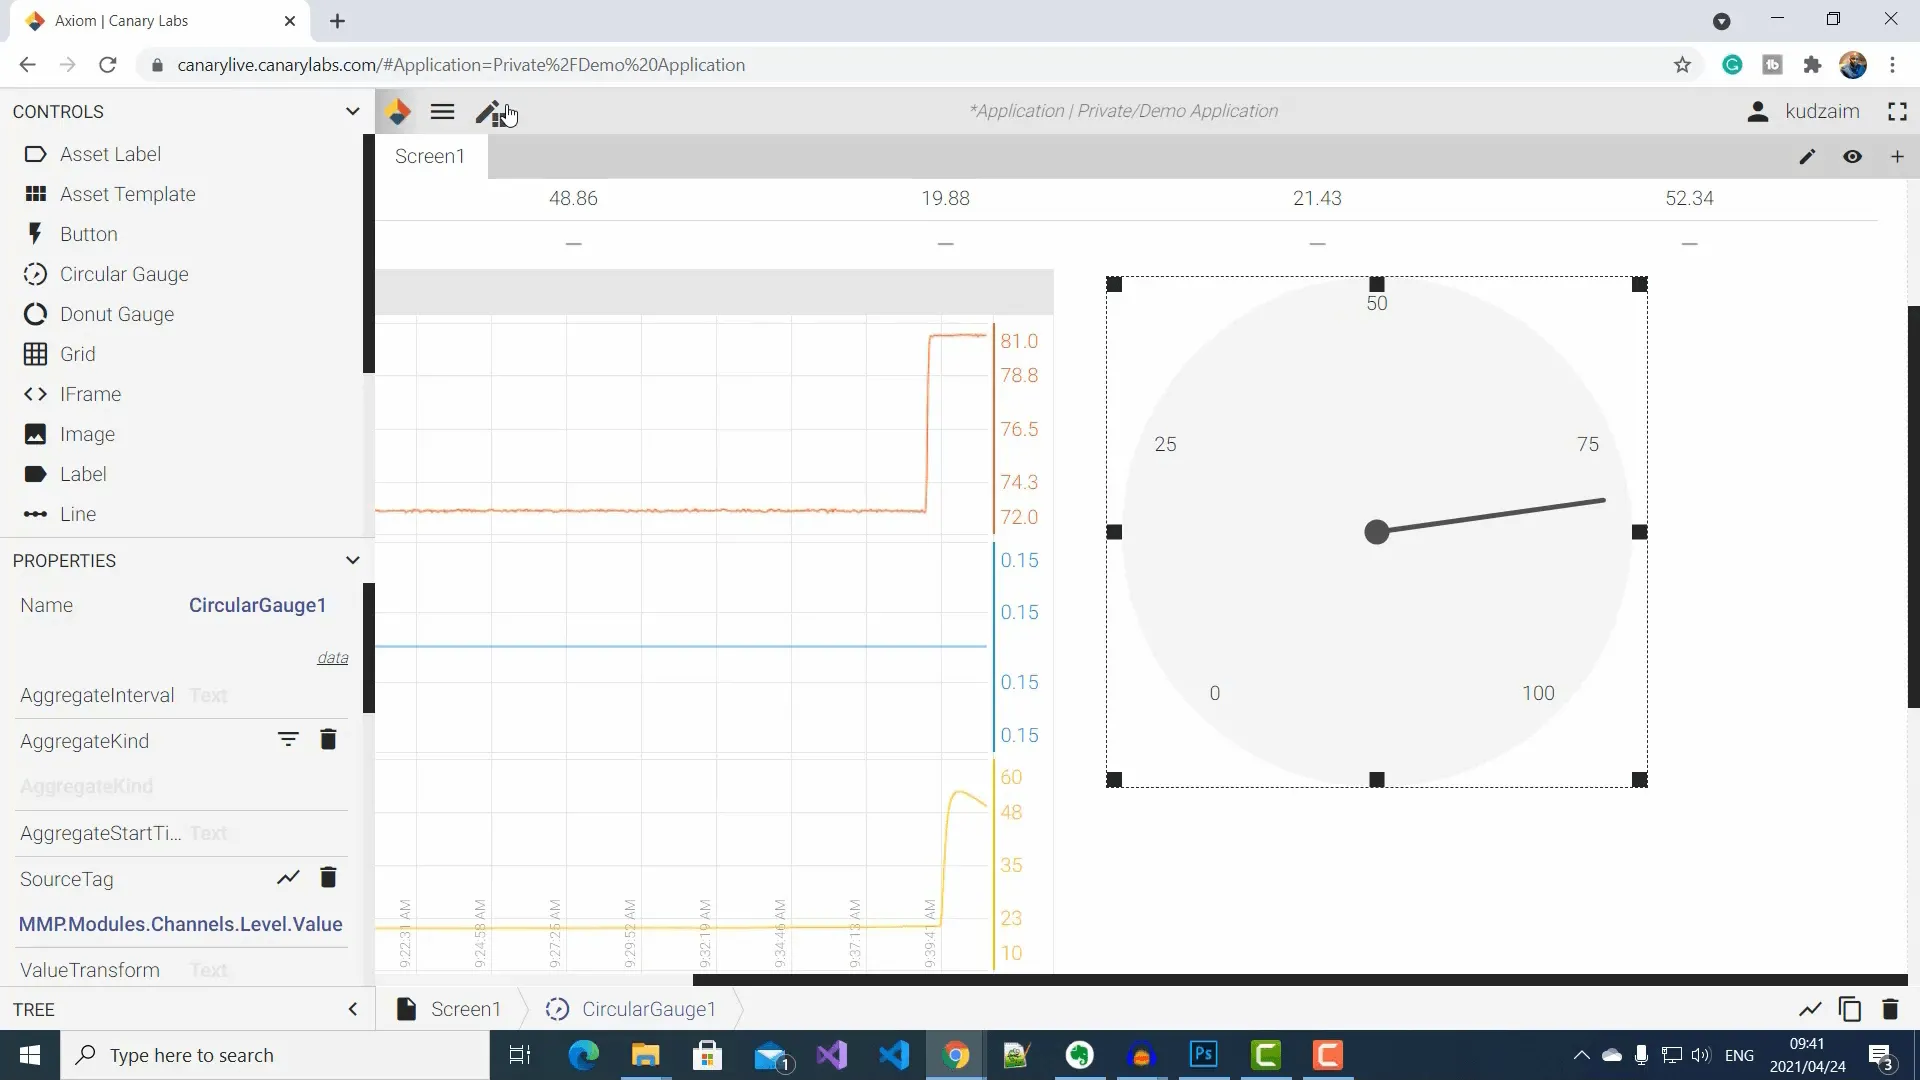
Add a Circular Gauge for measuring the liquid level as shown below.
While you have your Canary dashboard open, go to your Opto 22 Rio page.
Start observing the changes to the data instantly in the dashboard, as you pour liquid into the container, blow in to the transducer, or warm the liquid.
Conclusion: Overcome the Current Challenges of Industry 4.0 with MQTT Sparkplug
With this demonstration, you can see how easy it is to collect IIoT data from an edge device in your smart factory setup, send the data as MQTT Sparkplug B messages to HiveMQ Cloud MQTT broker, and forward it to Canary Historian for visualization.
Watch this demonstration in action
Read part 2 of this series, How to Send & Receive MQTT Sparkplug B Messages Using Raspberry Pis, Node-RED, and HiveMQ Cloud.

Kudzai Manditereza
Kudzai is a tech influencer and electronic engineer based in Germany. As a Sr. Industry Solutions Advocate at HiveMQ, he helps developers and architects adopt MQTT and HiveMQ for their IIoT projects. Kudzai runs a popular YouTube channel focused on IIoT and Smart Manufacturing technologies and he has been recognized as one of the Top 100 global influencers talking about Industry 4.0 online.
