HiveMQ - Monitoring with Graphite and Collectl
When running any server software in production, it is crucial to monitor relevant metrics and stats of your application, your software environment and your server (operating system). This gives you the opportunity to quickly react to unforseen events or problems. It may also help in finding out the problem in disaster cases and to reproduce the errors. And last but not least, it is important to know you are not flying blind, not recognizing the arising need of your production software to scale out or you just want to know the peak times to develop a better understanding of your users.
Tools
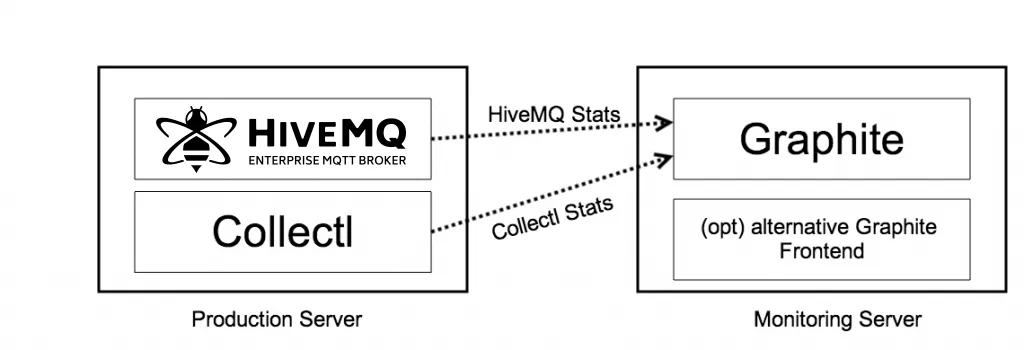
There are tons of tools for monitoring available and most of them do their job very well. For collecting and visualizing stats we favor Graphite, because it’s dead easy to integrate other tools with it and there are many third party tools available, which perfectly integrate with Graphite. HiveMQ has native support for Graphite and it’s extremely simple to enable it by configuration. For monitoring the server environment itself, we are using Collectl, which also offers a native Graphite integration.
Some people find the standard Graphite visualizations unpleasant and fortunately there are many third party visualizations like Graphene or Giraffe. If these visualizations attract you more, it’s easy to use them instead of standard Graphite.
Here is an overview of the architecture, which we use to monitor HiveMQ:
Graphite
Graphite is a graphic system which monitors and displays stats of different data sources and is also capable of aggregating them if needed. It’s highly scalable and very easy to extend with new data sources.
It’s strongly recommended to use a dedicated server instance for the monitoring server in production because in disaster cases you want at least the monitoring server to be running, even if your monitored server dies.
Collectl
Collectl is a handy tool for Linux servers, which collects stats about the server environment. Collectl is very friendly in terms of CPU and memory usage and is suitable for running in production environments. The built-in Graphite integration is trivial to configure. It may require some experimenting if you want to configure Collectl to monitor some very special system metrics, though.
Configuration
Install + Configuring Graphite
There are several ways to install Graphite. Graphite itself is written in Python, so you probably need to install Python first. Please consult the official installation guide for more information.
Graphite itself does not need any special configuration to start monitoring. The only thing left to do on the Graphite side is to add different monitoring widgets to your dashboard. You have to do this after the first metrics are published, otherwise Graphite does not know which stats you want to display.
Make sure you configure your firewall properly. The Graphite standard port for receiving metrics is 2003.
Install + Configuring Collectl
When using a Linux distribution, you can use your favorite package manager to install Collectl. When using RHEL or a RHEL compatible Linux (like CentOS) execute the following command:
yum install collectl
If you want the most recent Collectl version, you can download it from the official website and replace the version installed by your package manager manually. On a RHEL execute the following commands:
wget YOUR_SOURCEFORGE_MIRROR/collectl-3.6.7-1.el6.noarch.rpm
yum localinstall collectl-3.6.7-1.el6.noarch.rpm
Now we are ready to start collecting metrics of the HiveMQ production server. Execute the following command to start collecting metrics:
collectl -i 2 -scdnm --export graphite,GRAPHITE_IPThis command will collect stats every 2 seconds of the CPU, the RAM, the discs and the network. If you want other stats, please consult the Collectl documentation.
Configure HiveMQ
HiveMQ comes with a Graphite integration out of the box. Open your configuration.properties file and set the following properties:
graphite.enabled=true
graphite.interval=5
graphite.url=GRAPHITE_IP:PORT
statistics.enabled=true
That’s all, now HiveMQ is configured properly to report statistics every 5 seconds.
Creating a dashboard
All your data from Collectl and HiveMQ is now available in Graphite and you can proceed creating your dashboards as you want. Look here for a getting started guide to create Graphite Dashboards.
The HiveMQ Team
HiveMQ Team
The HiveMQ team loves writing about MQTT, Sparkplug, Industrial IoT, protocols, how to deploy our platform, and more. We focus on industries ranging from energy, to transportation and logistics, to automotive manufacturing. Our experts are here to help, contact us with any questions.
