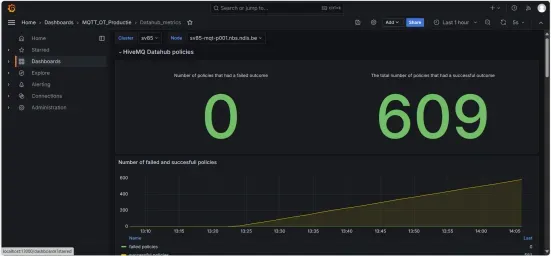
Visualizing HiveMQ Cluster and Node Metrics with Grafana
When managing MQTT infrastructures, gaining visibility into the performance and health of your HiveMQ clusters, nodes, and extensions is critical. Leveraging Grafana’s powerful visualization capabilities in combination with Prometheus metrics provided by HiveMQ, we created a suite of dashboards to monitor and manage these HiveMQ metrics. This post highlights the design and functionality of these dashboards to inspire and guide others in implementing similar solutions.
Setting Up HiveMQ Monitoring with Grafana and Prometheus
For this project, we worked with two operational HiveMQ clusters, each consisting of two nodes. Prometheus was set up as the metrics database for both clusters, and Grafana was used for visualization.
Read the blog HiveMQ - Monitoring with Prometheus and Grafana for a step-by-step guide to set up the Prometheus application with HiveMQ. And, read the blog MQTT Data Visualization with Grafana to set up a complete MQTT-to-Grafana pipeline for real-time analytics.
While HiveMQ provides the documentation on integrating Prometheus with their custom metrics, this post focuses on the Grafana side of the equation—particularly the dashboards. We designed for cluster and node monitoring, as well as extensions like Kafka, Data Hub, and Bridge.
Tracking HiveMQ Cluster Metrics Dashboard
The Cluster Metrics Dashboard provides an overview of critical HiveMQ metrics for an entire cluster. Some key highlights of this dashboard include:
Static and Time-series Visualizations: Key metrics like total connected clients and message throughput are displayed as static values. Time-series graphs show trends over time for these and other metrics.
Cluster Selector: A Grafana variable named
Clusterallows users to select which cluster’s data they want to view. This variable is seamlessly integrated into the Prometheus queries, automatically updating the dashboard to display metrics specific to the selected cluster.

Node Metrics Dashboard
The Node Metrics Dashboard dives deeper, offering insights into individual nodes within a cluster. It focuses more on the metrics of the machine running the node. Key features include:
Static and Time-series Visualizations: Like the Cluster dashboard, this dashboard also shows both static and time-series metrics.
Cluster and Node Selectors: Two Grafana variables,
ClusterandNode, allow users to refine their view. TheNodevariable is dependent on theClustervariable, meaning that selecting a cluster automatically updates the list of nodes available for selection. This is done by using the$Clustervariable within the options for theNodevariable. Once again, these variables are used within the Prometheus queries to automatically update the dashboard accordingly.

HiveMQ Extension-Specific Dashboards
In addition to cluster and node monitoring, we developed dashboards for specific HiveMQ extensions. These dashboards enable targeted monitoring of the additional functionalities provided by these extensions:
Kafka Extension Dashboard:
Tracks the number of messages forwarded to Kafka topics.
Displays throughput statistics for each Kafka topic.
Data Hub Extension Dashboard:
Visualizes metrics about the data streams managed by HiveMQ Data Hub.
Bridge Extension Dashboard:
Monitors bridge connections and their statuses.
Displays metrics related to message flow between primary and bridged MQTT brokers.


 Key Takeaways: Gaining Full Visibility into HiveMQ Metrics
Integrating Grafana with HiveMQ through Prometheus unlocks powerful monitoring capabilities. The dashboards described here—for clusters, nodes, and extensions—demonstrate how to turn raw metrics into actionable insights. Features like dynamic variables make these dashboards interactive and user-friendly, empowering teams to monitor and manage MQTT infrastructures effectively.

Leonard Van Vlierberghe
Leonard Van Vlierberghe is an AI & Software Engineer at Coretecs. Leonard specializes in Artificial Intelligence, Machine Learning, Low code, and IT. He is a calm and a collected young engineer who always keeps his options open and isn’t afraid to dig deep and explore.
