HiveMQ - Monitoring with Prometheus and Grafana
System monitoring is an essential part of any production-software deployment. Monitoring your MQTT brokers is crucial, especially in clustered environments. Classic challenges to effective monitoring include a lack of cohesive tools and the presence of a wrong mindset. It’s important not to fall victim to the false sense of security these factors create.
You need to monitor your system.
In this blog post, we’ll walk you through a detailed, step-by-step guide to set up the Prometheus application with HiveMQ. The goal: allow you to efficiently monitor massive amounts of your available HiveMQ metrics with Prometheus. Prometheus is one of the most popular solutions for monitoring distributed systems on the market today. In our opinion, it is the perfect companion for HiveMQ when it comes to monitoring.
To support the integration of cohesive monitoring tools, HiveMQ exposes a large number of metrics via JMX enabling JMX monitoring with tools like JConsole.
Real-time monitoring with tools like JConsole is certainly better than nothing, but some disadvantages exist. HiveMQ is often deployed with Docker and therefore direct access to the HiveMQ process might not be possible. Despite limitations, time-series monitoring solutions like Prometheus also function as great debugging tools, when you need to find the root cause of problems in your production environments.
The InfluxDB Extension and Prometheus Extension are free-of-charge and pre-built extensions that HiveMQ provides to enable time-series monitoring.
Prometheus and Grafana
We are often asked to recommend monitoring tools. So far, we have had good experiences with Prometheus. However, the tool that you choose to use is ultimately your decision and needs to reflect your personal preferences.
Prometheus is flexible. You can use Prometheus as a time-series database to gather and store metrics for your existing or preferred metric-visualization program can use as a data source. Or, you can use Prometheus as an all-in-one solution for both gathering metrics and generating your metric visualizations. This blog posts shows you how to use Prometheus to gather and visualize your HiveMQ metrics. We will also show you how to create a monitoring dashboard using Prometheus as a data source in Grafana.
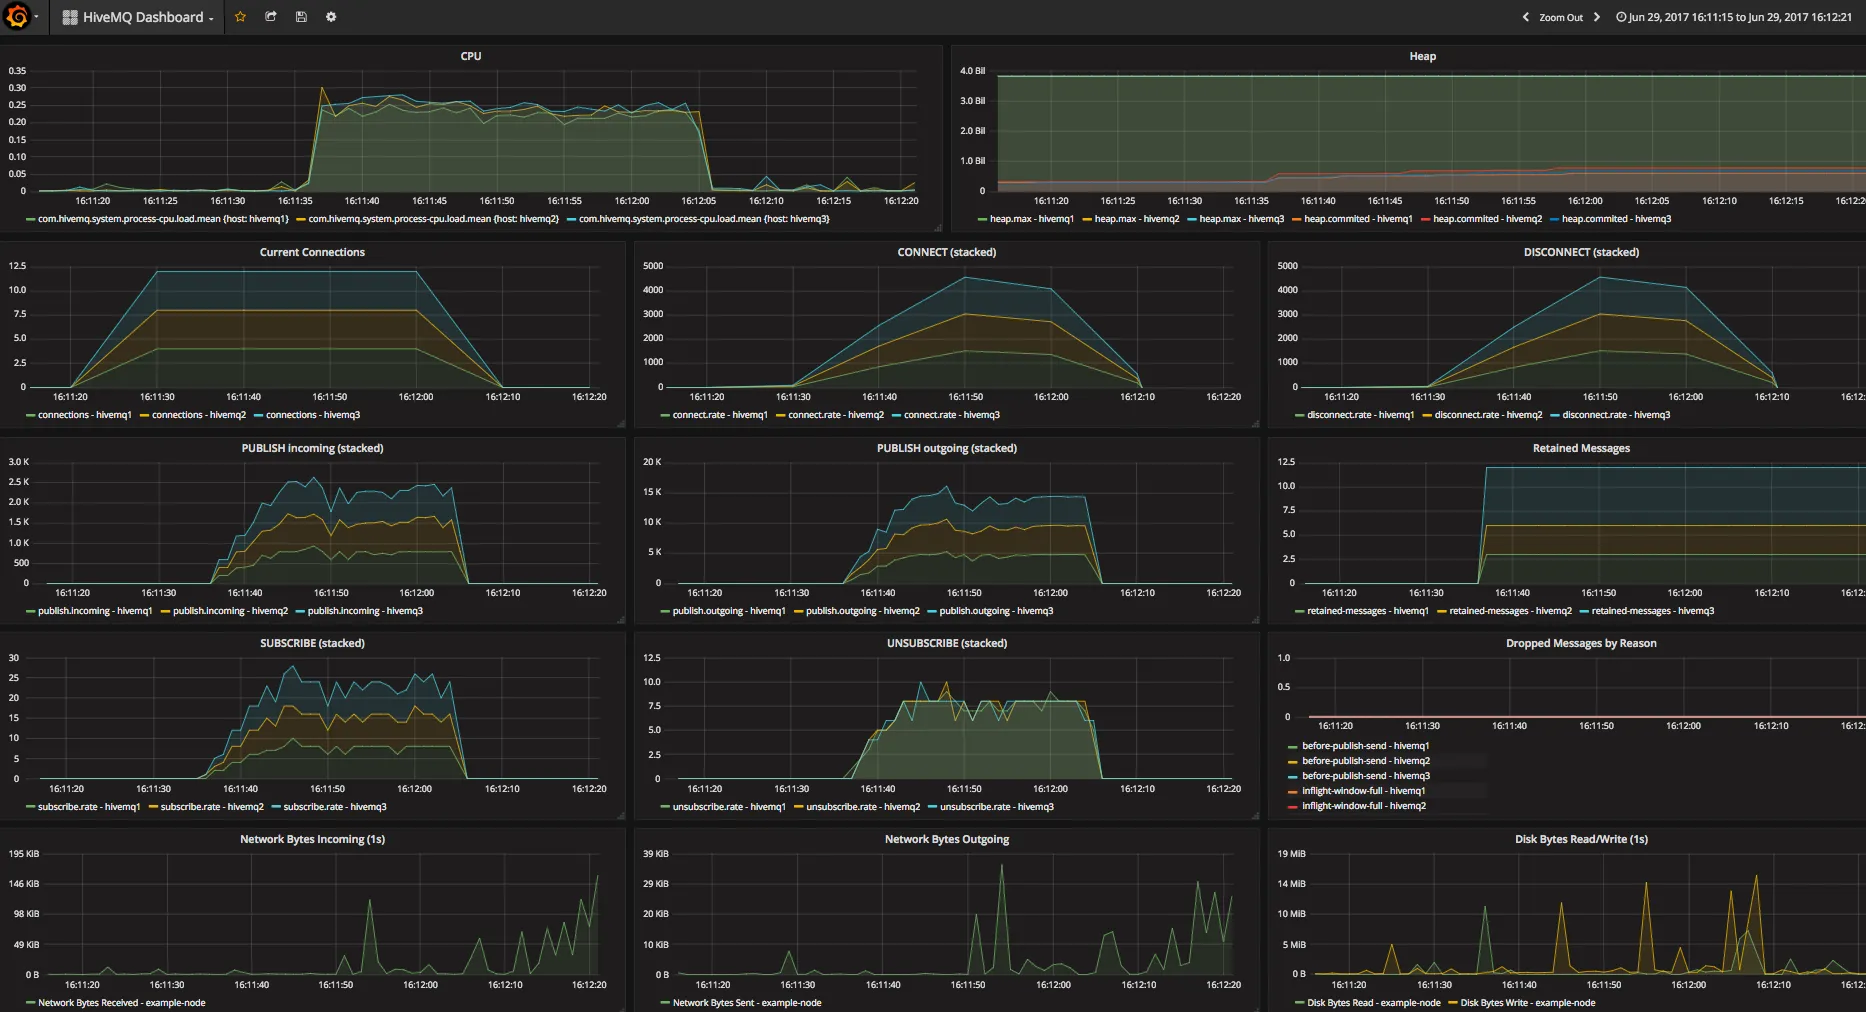
 Example Dashboard
Installation and configuration
In this installation, we want our HiveMQ clusters to report their metrics to Prometheus. Then, we can set up a Grafana dashboard for real-time monitoring of our HiveMq metrics.
To fulfill our plan, we’ll need three pieces of software in addition to our HiveMQ cluster:
The HiveMQ Prometheus Monitoring Extension
Prometheus
Grafana
Installing the Prometheus HiveMQ Extension
HiveMQ offers a wide range of pre-built and ready-to-use extensions. One of these extensions is the HiveMQ Prometheus Monitoring Extension. The installation of this extension, like all HiveMQ extensions, is very simple:
Download the distribution
Unpack the zip file
Move the hivemq-prometheus-extension folder to the extensions folder
Note: Always adjust the prometheusConfiguration.properties file inside the hivemq-prometheus-extension folder to suit your individual needs and make sure that the IP address of the network interface can be reached by your Prometheus server.
# Prometheus Monitoring Extension Configuration
#
# -------------------------------------------------------------------------


# The ip where the servlet will be hosted
ip=<your-ip>

# The port where the servlet will work on
port=9399

# The path for the servlet which gets called by prometheus
# For example 127.0.0.1:9399/metrics
metric_path=/metrics
Installing Prometheus
The next step is to install the Prometheus application on a machine of your choice. In our experience, you should not run Prometheus on the same machine on which you are running HiveMQ.
To install Prometheus, follow the Prometheus Guide.
A working prometheus.yml file that is based on the HiveMQ Prometheus Extension configuration in this post, looks like this:
global:
  scrape_interval: 15s
scrape_configs:
  - job_name: 'hivemq'
    scrape_interval: 5s
    metrics_path: '/metrics'
    static_configs:
      #using port 9399 because we configured it the HiveMQ Prometheus Extension
      - targets: ['<node1-ip>:9399', '<node2-ip>:9399']
Note: This example is tailored for a 2 node cluster. If you want more nodes, you need to add the additional nodes to the targets.
Using Prometheus for displaying metrics
Prometheus is more than just a data source for monitoring dashboards like Grafana. Additionally, Prometheus comes with built-in functionality to display metrics on-the-fly. This ability is particularly helpful when you want an in-depth look into specific metrics that you don’t monitor constantly. To take a look, navigate to http://:9090/. When Prometheus and the HiveMQ Prometheus extension are configured correctly, you can access your HiveMQ metrics in the Expression field.
 Displaying HiveMQ metrics in Prometheus
Installing Grafana
The next step on our way to building a monitoring dashboard is installing and starting Grafana. Grafana works out of the box and is reached via localhost:3000.
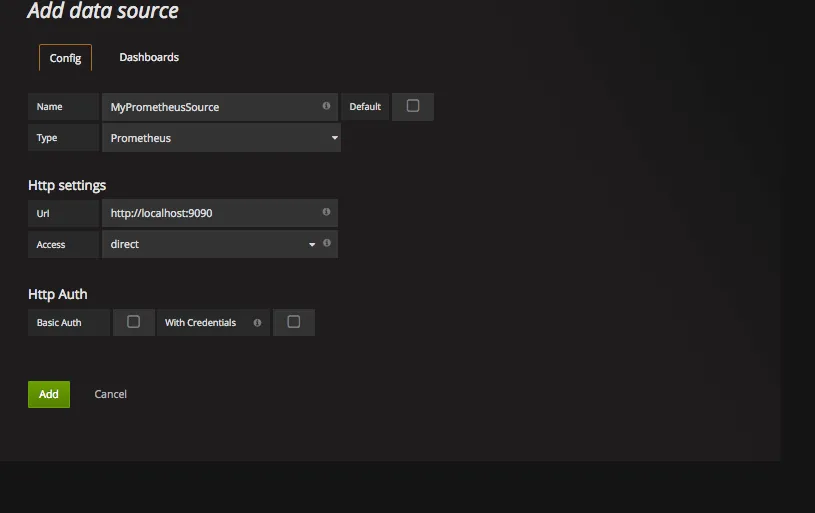
Once Grafana is up and running, we can configure Prometheus to be the data source for Grafana.
 Step 1: Add Data Source
 Step 2: Configuring Prometheus
Now, we can focus on the dashboard. In response to the high number of questions we receive about dashboards, the HiveMQ team has put together a great little dashboard template that displays the key metrics for most MQTT deployments. Use the template as a convenient starting point for building a dashboard that is perfectly tailored to your individual use case.
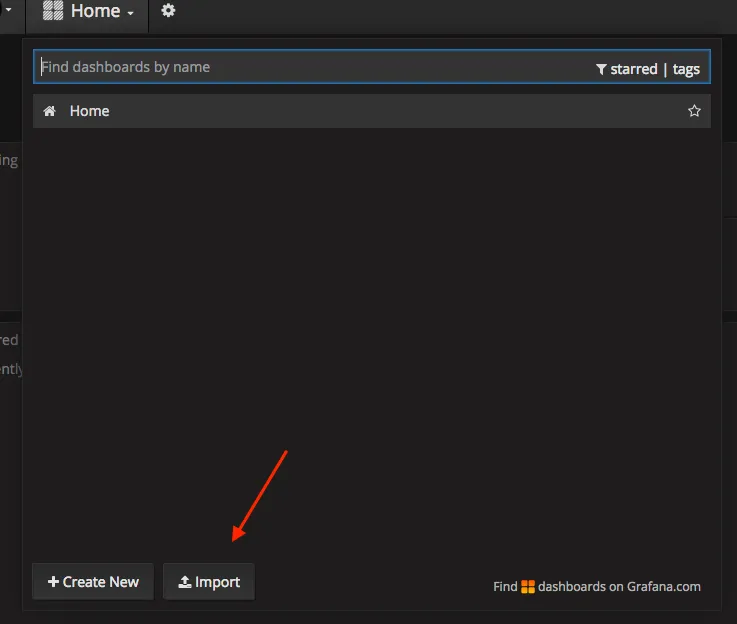
Download the template right here. The JSON file inside the zip can be imported to Grafana.
 Step 3: Import Dashboard
That’s it. We now have a working dashboard that displays our metrics and provides the type of monitoring that has proven vital in many MQTT deployments.
This is just one possibility for monitoring your MQTT use case. Your individual requirements can vary. We suggest reading the getting started guide from Grafana to decide what works best for you and your deployment.
Summary and resource list
Monitoring is an important part of operations for any application and HiveMQ is no exception. As you can see from this blog post, it is not difficult to create a monitoring setup for HiveMQ with Prometheus and Grafana. We hope that our dashboard template gets you off to a good start and strongly recommend that you fine tune your dashboards to meet the individual needs of each deployment.
Here are some useful resources:

