Using MQTT and Raspberry Pi to Visualize Sensor Data on a TilesFX Dashboard
In the first post of this blog series, MQTT on Raspberry Pi: Send Sensor Data to HiveMQ Cloud with Java and Pi4J, you learnt how to use HiveMQ Cloud MQTT broker with Java on the Raspberry Pi. The post explained how to create an application to send measurements of various sensors to the HiveMQ Cloud MQTT broker. Using an online websocket client, we verified the transition of the messages, and saw the data being published to this online message queue. In this second post, you will learn how to subscribe to MQTT Topics, use Java on the Raspberry Pi mini computer to send sensor data to HiveMQ Cloud MQTT broker, and visualize it on a JavaFX dashboard.
Using MQTT and JavaFX for Visualizing GPIO Data
JavaFX is a set of graphics and media packages that enables developers to design, create, test, debug, and deploy rich client applications that operate consistently across diverse platforms.
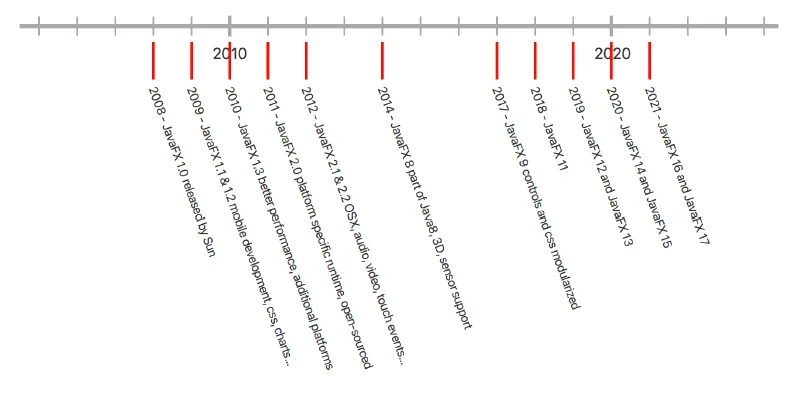
JavaFX was created by Sun Microsystems, later became part of Oracle Corporation and is now an open source project on openjfx.io. Commercial support is available via GluonHQ, which is also the main maintainer of the project, with the support of many contributors (including Oracle). The sources are available on GitHub. Since version 11, the JavaFX module moved out of the Oracle JDK. With a similar 6- month release cycle of Java, JavaFX development speed has increased, pushing new features forward. JavaFX allows you to quickly build a user interface while using the language and tools you already know as a Java developer. This can be styled with a CSS syntax and is very flexible and extendable and even allows you to draw your own layout elements as you can see in the history graph above, available on GitHub as part of the sources of my book “Getting Started with Java on the Raspberry Pi”.
JavaFX on the Raspberry Pi
JavaFX can be installed in two ways on the Raspberry Pi:
By installing a JDK which has JavaFX bundled. Azul and BellSoft provide such versions.
By installing it separately by using the latest version which can be downloaded from the GluonHQ website.
Personally, I prefer the second approach as you are sure to be using the latest JavaFX runtime, including all improvements for embedded devices. As this is a fast evolving market, there are a lot of ongoing changes like improved rendering and Direct Rendering Mode (DRM, also known as Kiosk Mode). An article with more information regarding this topic can be found on “JavaFX Running in Kiosk Mode on the Raspberry Pi”.
TilesFX Library
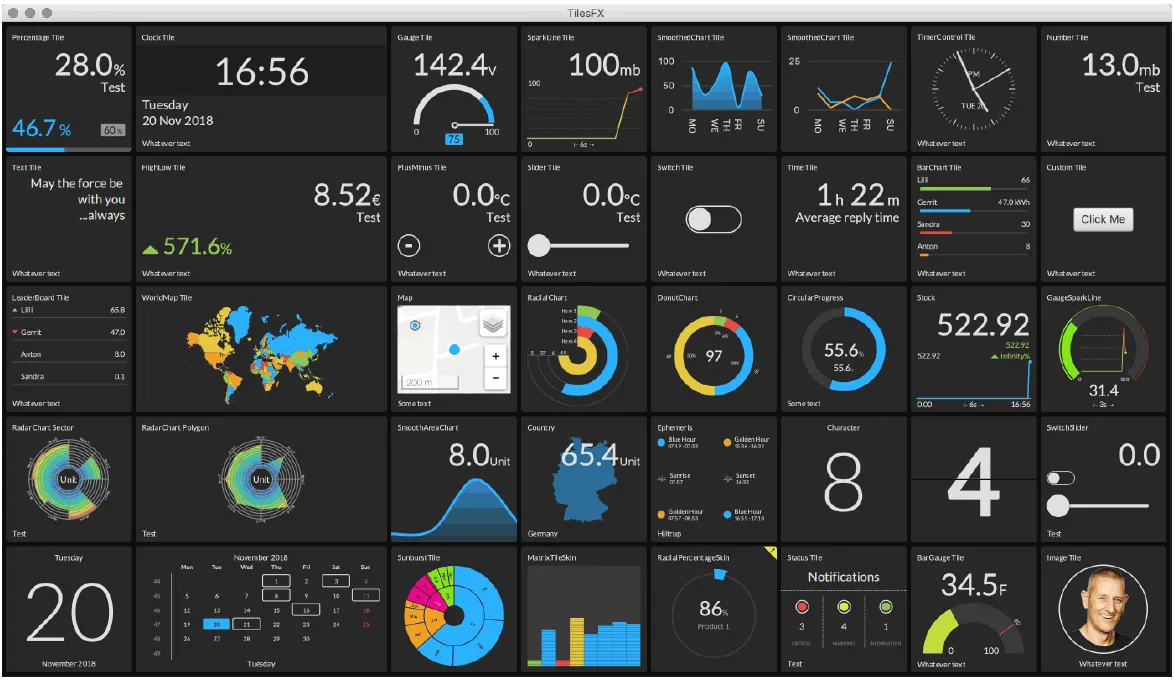
This great library is developed by Gerrit Grunwald and provides tiles to build dashboards. Check his blog for many more JavaFX examples!
You can find the the sources of TilesFX on GitHub, and it is available as a Maven dependency. As part of the sources of TilesFX, a Demo application is provided to show how to use all the available Tiles.
Visualizing Sensor Values Sent to HiveMQ Cloud Using JavaFX Application
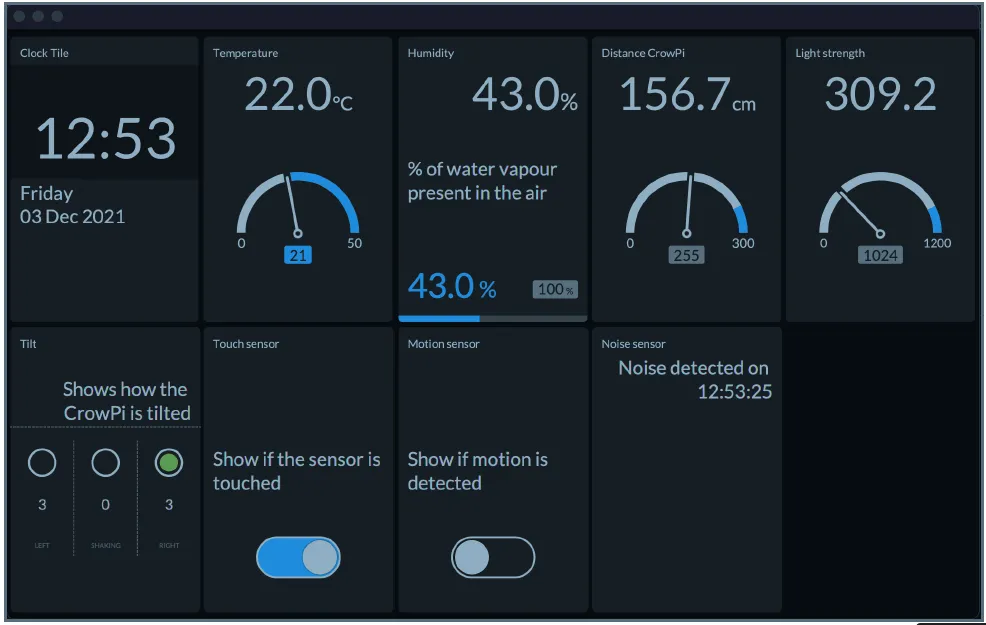
Let’s create a JavaFX application to visualize all the sensor values we pushed to HiveMQ Cloud with the application we created in the previous part.
JavaFX Library Dependencies
This project requires a few different dependencies compared to the message sender. Of course, we use the HiveMQ MQTT client again. But for the graphical user interface parts, we need some JavaFX libraries (only controls are used in the application, but others are referenced by TilesFX) and the TilesFX library itself.
<dependency>
   <groupId>com.hivemq</groupId>
   <artifactId>hivemq-mqtt-client</artifactId>
   <version>${hivemq.version}</version>
</dependency>

<dependency>
    <groupId>org.openjfx</groupId>
    <artifactId>javafx-controls</artifactId>
    <version>${javafx.version}</version>
</dependency>
<dependency>
    <groupId>org.openjfx</groupId>
    <artifactId>javafx-media</artifactId>
    <version>${javafx.version}</version>
</dependency>
<dependency>
    <groupId>org.openjfx</groupId>
    <artifactId>javafx-web</artifactId>
    <version>${javafx.version}</version>
</dependency>

<dependency>
    <groupId>eu.hansolo</groupId>
    <artifactId>tilesfx</artifactId>
    <version>${tilesfx.version}</version>
</dependency>
Full Code on GitHub
The sources of this application are available on GitHub in the same repository as the previous post.
TIP: All three videos accompanying this MQTT on Raspberry Pi blog post series are avialable on our YouTube Channel. Be sure to watch and complement your knowledge.
Starting the JavaFX application
We need to extend from JavaFX Application and in this case we configure the HiveMQ Client in the start method. This could also be done in a separate class, but for this proof-of-concept it’s easy to use the client-reference to provide it to the child objects.
For easy maintenance of the topics, these are also defined here.
public class HiveMqClient extends Application {

    private static final Logger logger = LogManager.getLogger(HiveMqClient.class.getName());

    public static final String TOPIC_MOTION = "crowpi/motion";
    public static final String TOPIC_NOISE = "crowpi/noise";
    public static final String TOPIC_SENSORS = "crowpi/sensors";
    public static final String TOPIC_TILT = "crowpi/tilt";
    public static final String TOPIC_TOUCH = "crowpi/touch";

    private static final String HIVEMQ_SERVER = "ID_OF_YOUR_INSTANCE.s1.eu.hivemq.cloud";
    private static final String HIVEMQ_USER = "YOUR_USERNAME";
    private static final String HIVEMQ_PASSWORD = "YOUR_PASSWORD";
    private static final int HIVEMQ_PORT = 8883;

    @Override
    public void start(Stage stage) {
        logger.info("Starting up...");

        Mqtt5AsyncClient client = MqttClient.builder()
                .useMqttVersion5()
                .identifier("JavaFX_" + UUID.randomUUID())
                .serverHost(HIVEMQ_SERVER)
                .serverPort(HIVEMQ_PORT)
                .sslWithDefaultConfig()
                .buildAsync();

        client.connectWith()
                .simpleAuth()
                .username(HIVEMQ_USER)
                .password(HIVEMQ_PASSWORD.getBytes())
                .applySimpleAuth()
                .send()
                .whenComplete((connAck, throwable) -> {
                    if (throwable != null) {
                        logger.error("Could not connect to HiveMQ: {}", throwable.getMessage());
                    } else {
                        logger.info("Connected to HiveMQ: {}", connAck.getReasonCode());
                    }
                });

        var scene = new Scene(new DashboardView(client), 1024, 620);
        stage.setScene(scene);
        stage.show();
    }

    public static void main(String[] args) {
        launch();
    }
}
Visualizing Data in a Dashboard
In the Dashboard View, all the tiles are defined we want to add to our screen. Please have a look at the full sources for all the tiles. Here you find the code of two of them:
public class DashboardView extends FlowGridPane {

    private static final Logger logger = LogManager.getLogger(DashboardView.class.getName());

    private final ObjectMapper mapper = new ObjectMapper();

    private final Tile gaucheTemperature;
    private final Tile gaucheDistance;
    private final Tile gaucheLight;
    private final Tile percentageHumidity;

    public DashboardView(Mqtt5AsyncClient client) {
        super(5, 2);

        logger.info("Creating dashboard view");

        setHgap(5);
        setVgap(5);
        setAlignment(Pos.CENTER);
        setCenterShape(true);
        setPadding(new Insets(5));
        setBackground(new Background(new BackgroundFill(Color.web("#101214"), CornerRadii.EMPTY, Insets.EMPTY)));

        ...

        gaucheTemperature = TileBuilder.create()
                .skinType(Tile.SkinType.GAUGE)
                .prefSize(TILE_WIDTH, TILE_HEIGHT)
                .title("Temperature")
                .unit("°C")
                .threshold(21)
                .maxValue(50)
                .build();

        ...

        getChildren().addAll(
                clockTile,
                gaucheTemperature,
                percentageHumidity,
                gaucheDistance,
                gaucheLight,
                new TiltStatusTile(client, TOPIC_TILT),
                new SensorSwitchTile(client, TOPIC_TOUCH, "Touch sensor", "Show if the sensor is touched"),
                new SensorSwitchTile(client, TOPIC_MOTION, "Motion sensor", "Show if motion is detected"),
                new NoiseTextTile(client, TOPIC_NOISE));

        ...
    }

    ...
}
GaucheTemperature
The temperature is one of the sensor values which is sent with an interval from the CrowPi. After subscribing to the sensor-topic, we will receive this data. By using the same Sensor-class as we used in the sender-application, we can easily map the received String to a Java-object.
The GaucheTemperature-tile and the other ones we initialized in the constructor, can now be updated with the received data.
...

        client.toAsync().subscribeWith()
                .topicFilter(TOPIC_SENSORS)
                .qos(MqttQos.AT_LEAST_ONCE)
                .callback(this::handleSensorData)
                .send();

    ...

    private void handleSensorData(Mqtt5Publish message) {
        var sensorData = new String(message.getPayloadAsBytes());
        logger.info("Sensor data: {}", sensorData);
        try {
            var sensor = mapper.readValue(sensorData, Sensor.class);
            gaucheTemperature.setValue(sensor.getTemperature());
            percentageHumidity.setValue(sensor.getHumidity());
            gaucheDistance.setValue(sensor.getDistance());
            gaucheLight.setValue(sensor.getLight());
        } catch (JsonProcessingException ex) {
            logger.error("Could not parse the data to JSON: {}", ex.getMessage());
        }
    }
SensorSwitchTile
Other data is sent by the publisher when the state of the sensor changes. For instance, when the touch sensor is touched or released, we will receive a true or false on a specific topic. To be able to handle this easily, additional components are created which extend from the Tile-class.
The SensorSwitchTile contains a SWITCH-tile and its active state is changed according to the value in every received message.
public class SensorSwitchTile extends BaseTile {
    private final Tile statusTile;
    public SensorSwitchTile(Mqtt5AsyncClient client, String topic, String title, String description) {
        super(client, topic);
        statusTile = TileBuilder.create()
                .skinType(SkinType.SWITCH)
                .prefSize(TILE_WIDTH, TILE_HEIGHT)
                .title(title)
                .description(description)
                .build();
        getChildren().add(statusTile);
    }
    @Override
    public void handleMessage(Mqtt5Publish message) {
        var sensorData = new String(message.getPayloadAsBytes());
        logger.info("Boolean sensor data: {}", sensorData);
        try {
            var sensor = mapper.readValue(sensorData, BooleanValue.class);
            Platform.runLater(() -> {
                statusTile.setActive(sensor.getValue());
            });
        } catch (JsonProcessingException ex) {
            logger.error("Could not parse the data to JSON: {}", ex.getMessage());
        }
    }
}
The subscription to the topic is handled in the BaseTile-class to avoid duplicate code.
public class BaseTile extends Pane {

    protected static final Logger logger = LogManager.getLogger(BaseTile.class.getName());

    protected final ObjectMapper mapper = new ObjectMapper();

    public static final int TILE_WIDTH = 200;
    public static final int TILE_HEIGHT = 300;

    public BaseTile(Mqtt5AsyncClient client, String topic) {
        client.toAsync().subscribeWith()
                .topicFilter(topic)
                .qos(MqttQos.AT_LEAST_ONCE)
                .callback(this::handleMessage)
                .send();
    }

    /**
     * Method to be overridden in each tile.
     */
    protected void handleMessage(Mqtt5Publish message) {
        logger.warn("Message not handled: {}", message.getPayloadAsBytes());
    }
}
As you can see, subscribing to a HiveMQ Cloud message only needs a minimal amount of code.
Building and Running a Java Application
On Developer PC
This project doesn’t call any Raspberry Pi-specific functions compared to the GPIO-interface in the previous application, so we can run it on any PC. Also, here you have the choice to use a JDK which includes the JavaFX runtime dependencies, or a separate download. Both approaches are described more in detail on “Starting a JavaFX Project with Gluon Tools”.
On the other hand, when starting from IntelliJ IDEA, the Maven dependencies will take care of all this for you.
On Raspberry Pi
To run this application on a Raspberry Pi 4, I started with a new SD card with the standard Raspberry Pi OS (32-bit). This is a “minimal” version of the Raspberry Pi OS, and doesn’t include Java, but this can be quickly fixed by running
 sudo apt install openjdk-11-jdk in the terminal.
$ java -version
bash: java: command not found
$ sudo apt update
$ sudo apt install openjdk-11-jdk
$ java -version
openjdk version "11.0.13" 2021-10-19
OpenJDK Runtime Environment (build 11.0.13+8-post-Raspbian-1deb11u1)
OpenJDK Server VM (build 11.0.13+8-post-Raspbian-1deb11u1, mixed mode)
Nice! Now we can already run Java-code on our Raspberry Pi. But for JavaFX we need the runtime which is compiled specifically for the Raspberry Pi. Gluon provides these versions via their website. We only need to download a file, unzip it, and put in a place which we will reference when we start the application.
$ wget -O openjfx.zip https://gluonhq.com/download/javafx-17-ea-sdk-linux arm32/
$ unzip openjfx.zip
$ sudo mv javafx-sdk-17/ /opt/javafx-sdk-17/
As this dashboard application is a Maven project, we still need to install it, after which we can get the full project and build it on the Raspberry Pi. Follow these steps:
$ sudo apt install maven
$ git clone https://github.com/FDelporte/HiveMQ-examples.git
$ cd HiveMQ-examples/javafx-ui-hivemq
$ mvn package
$ cd target/distribution
$ bash run.sh
The run.sh script combines the compiled application jars, with the platform-specific JavaFX runtime and starts the application.
Conclusion: Using MQTT, JavaFX, & TilesFX for Visualizing Sensor Data
TilesFX is only one of the many open-source libraries you can use in your application, or you can create your own components. Gerrit Grunwald and other writers have explained this approach on foojay.io in multiple posts.
By using JavaFX, you can quickly develop beautiful user interfaces, and combined with HiveMQ Cloud this results in a nice dashboard application to visualize sensor data. By running this application on the Raspberry Pi, you can have an always-on dashboard screen for a very low price.
In the next post of this series, Sending sensor data from Raspberry Pi Pico to HiveMQ Cloud, I will show you how to add some more data to the messaging system with another member of the Raspberry Pi family, Raspberry Pi Pico.
Take your MQTT projects to the next level with HiveMQ Cloud Starter. Experience unmatched performance and reliability with our 15-day free trial, no credit card required.

Frank Delporte
Frank Delporte is Senior Technical Writer at Azul. He’s the author of the ebook "Getting started with Java on Raspberry Pi."
